
AI in maps

Data centres are set up where electricity is available, the grid is strong and water is accessible. These maps show, country by country, what makes the footprint of the same computation vary.

Fiji: 278 gCO2e/kWhTanzania: 345 gCO2e/kWhWestern Sahara: no dataCanada: 191 gCO2e/kWhUnited States: 384 gCO2e/kWhKazakhstan: 805 gCO2e/kWhUzbekistan: 1,000 gCO2e/kWhPapua New Guinea: 514 gCO2e/kWhIndonesia: 680 gCO2e/kWhArgentina: 346 gCO2e/kWhChile: 290 gCO2e/kWhDR Congo: 28 gCO2e/kWhSomalia: 512 gCO2e/kWhKenya: 95 gCO2e/kWhSudan: 154 gCO2e/kWhChad: 622 gCO2e/kWhHaiti: 535 gCO2e/kWhDominican Republic: 538 gCO2e/kWhRussia: 450 gCO2e/kWhBahamas: 653 gCO2e/kWhFalkland Islands: 1,000 gCO2e/kWhNorway: 28 gCO2e/kWhGreenland: 150 gCO2e/kWhFrench Southern Territories: no dataTimor-Leste: 667 gCO2e/kWhSouth Africa: 699 gCO2e/kWhLesotho: no dataMexico: 474 gCO2e/kWhUruguay: 80 gCO2e/kWhBrazil: 110 gCO2e/kWhBolivia: 481 gCO2e/kWhPeru: 238 gCO2e/kWhColombia: 187 gCO2e/kWhPanama: 221 gCO2e/kWhCosta Rica: 24 gCO2e/kWhNicaragua: 301 gCO2e/kWhHonduras: 322 gCO2e/kWhEl Salvador: 139 gCO2e/kWhGuatemala: 302 gCO2e/kWhBelize: 170 gCO2e/kWhVenezuela: 86 gCO2e/kWhGuyana: 645 gCO2e/kWhSuriname: 322 gCO2e/kWhFrance: 41 gCO2e/kWhEcuador: 159 gCO2e/kWhPuerto Rico: 655 gCO2e/kWhJamaica: 563 gCO2e/kWhCuba: 643 gCO2e/kWhZimbabwe: 384 gCO2e/kWhBotswana: 851 gCO2e/kWhNamibia: 49 gCO2e/kWhSenegal: 540 gCO2e/kWhMali: 539 gCO2e/kWhMauritania: 512 gCO2e/kWhBenin: 584 gCO2e/kWhNiger: 674 gCO2e/kWhNigeria: 456 gCO2e/kWhCameroon: 226 gCO2e/kWhTogo: 423 gCO2e/kWhGhana: 469 gCO2e/kWhIvory Coast: 405 gCO2e/kWhGuinea: 181 gCO2e/kWhGuinea-Bissau: 625 gCO2e/kWhLiberia: 316 gCO2e/kWhSierra Leone: 48 gCO2e/kWhBurkina Faso: 562 gCO2e/kWhCentral African Republic: 0 gCO2e/kWhRepublic of the Congo: 716 gCO2e/kWhGabon: 523 gCO2e/kWhEquatorial Guinea: 644 gCO2e/kWhZambia: 120 gCO2e/kWhMalawi: 55 gCO2e/kWhMozambique: 129 gCO2e/kWhKingdom of Eswatini: 131 gCO2e/kWhAngola: 185 gCO2e/kWhBurundi: 184 gCO2e/kWhIsrael: 493 gCO2e/kWhLebanon: 390 gCO2e/kWhMadagascar: 432 gCO2e/kWhPalestine: 414 gCO2e/kWhGambia: 667 gCO2e/kWhTunisia: 560 gCO2e/kWhAlgeria: 633 gCO2e/kWhJordan: 530 gCO2e/kWhUnited Arab Emirates: 468 gCO2e/kWhQatar: 582 gCO2e/kWhKuwait: 635 gCO2e/kWhIraq: 683 gCO2e/kWhOman: 545 gCO2e/kWhVanuatu: 500 gCO2e/kWhCambodia: 499 gCO2e/kWhThailand: 546 gCO2e/kWhLaos: 232 gCO2e/kWhMyanmar: 503 gCO2e/kWhVietnam: 461 gCO2e/kWhNorth Korea: 341 gCO2e/kWhSouth Korea: 417 gCO2e/kWhMongolia: 816 gCO2e/kWhIndia: 670 gCO2e/kWhBangladesh: 696 gCO2e/kWhBhutan: 24 gCO2e/kWhNepal: 24 gCO2e/kWhPakistan: 347 gCO2e/kWhAfghanistan: 131 gCO2e/kWhTajikistan: 73 gCO2e/kWhKyrgyzstan: 153 gCO2e/kWhTurkmenistan: 1,306 gCO2e/kWhIran: 660 gCO2e/kWhSyria: 706 gCO2e/kWhArmenia: 212 gCO2e/kWhSweden: 35 gCO2e/kWhBelarus: 309 gCO2e/kWhUkraine: no dataPoland: 589 gCO2e/kWhAustria: 117 gCO2e/kWhHungary: 163 gCO2e/kWhMoldova: 633 gCO2e/kWhRomania: 251 gCO2e/kWhLithuania: 138 gCO2e/kWhLatvia: 139 gCO2e/kWhEstonia: 319 gCO2e/kWhGermany: 330 gCO2e/kWhBulgaria: 276 gCO2e/kWhGreece: 315 gCO2e/kWhTurkey: 475 gCO2e/kWhAlbania: 25 gCO2e/kWhCroatia: 159 gCO2e/kWhSwitzerland: 39 gCO2e/kWhLuxembourg: 123 gCO2e/kWhBelgium: 150 gCO2e/kWhNetherlands: 254 gCO2e/kWhPortugal: 128 gCO2e/kWhSpain: 154 gCO2e/kWhIreland: 257 gCO2e/kWhNew Caledonia: 561 gCO2e/kWhSolomon Islands: 636 gCO2e/kWhNew Zealand: 93 gCO2e/kWhAustralia: 525 gCO2e/kWhSri Lanka: 329 gCO2e/kWhChina: 525 gCO2e/kWhTaiwan: 633 gCO2e/kWhItaly: 285 gCO2e/kWhDenmark: 114 gCO2e/kWhUnited Kingdom: 217 gCO2e/kWhIceland: 28 gCO2e/kWhAzerbaijan: 632 gCO2e/kWhGeorgia: 146 gCO2e/kWhPhilippines: 588 gCO2e/kWhMalaysia: 602 gCO2e/kWhBrunei Darussalam: 892 gCO2e/kWhSlovenia: 183 gCO2e/kWhFinland: 58 gCO2e/kWhSlovakia: 95 gCO2e/kWhCzechia: 402 gCO2e/kWhEritrea: 578 gCO2e/kWhJapan: 477 gCO2e/kWhParaguay: 25 gCO2e/kWhYemen: 592 gCO2e/kWhSaudi Arabia: 692 gCO2e/kWhNorthern Cyprus: no dataCyprus: 489 gCO2e/kWhMorocco: 596 gCO2e/kWhEgypt: 563 gCO2e/kWhLibya: 827 gCO2e/kWhEthiopia: 23 gCO2e/kWhDjibouti: 450 gCO2e/kWhSomaliland: no dataUganda: 59 gCO2e/kWhRwanda: 354 gCO2e/kWhBosnia and Herzegovina: 571 gCO2e/kWhNorth Macedonia: 441 gCO2e/kWhSerbia: 696 gCO2e/kWhMontenegro: 264 gCO2e/kWhKosovo: 901 gCO2e/kWhTrinidad and Tobago: 682 gCO2e/kWhSouth Sudan: 643 gCO2e/kWh

Carbon intensity of electricity, country by country

Emissions from producing one kilowatt-hour, on a life cycle basis, 2025 or latest year published. The electricity for the same computation emits 14 times more CO2e in Poland than in France.

589Poland, gCO2e/kWh41France× 14Poland and France, same electricity
Sources: Ember and Our World in Data.

World maps

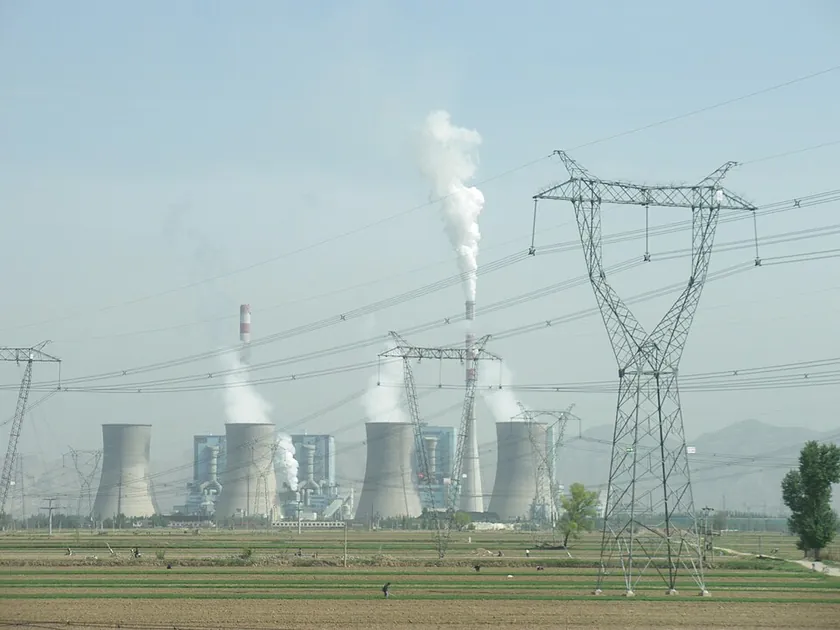
The Shuozhou coal power plant, in China: cooling towers and smoking chimneys behind high-voltage pylons, at the edge of the fields
China525 gCO2e/kWhThe Shuozhou coal power plant, in Shanxi (China).Photo Kleineolive, Wikimedia Commons, CC BY 3.0
Fiji: 278 gCO2e/kWhTanzania: 345 gCO2e/kWhWestern Sahara: no dataCanada: 191 gCO2e/kWhUnited States: 384 gCO2e/kWhKazakhstan: 805 gCO2e/kWhUzbekistan: 1,000 gCO2e/kWhPapua New Guinea: 514 gCO2e/kWhIndonesia: 680 gCO2e/kWhArgentina: 346 gCO2e/kWhChile: 290 gCO2e/kWhDR Congo: 28 gCO2e/kWhSomalia: 512 gCO2e/kWhKenya: 95 gCO2e/kWhSudan: 154 gCO2e/kWhChad: 622 gCO2e/kWhHaiti: 535 gCO2e/kWhDominican Republic: 538 gCO2e/kWhRussia: 450 gCO2e/kWhBahamas: 653 gCO2e/kWhFalkland Islands: 1,000 gCO2e/kWhNorway: 28 gCO2e/kWhGreenland: 150 gCO2e/kWhFrench Southern Territories: no dataTimor-Leste: 667 gCO2e/kWhSouth Africa: 699 gCO2e/kWhLesotho: no dataMexico: 474 gCO2e/kWhUruguay: 80 gCO2e/kWhBrazil: 110 gCO2e/kWhBolivia: 481 gCO2e/kWhPeru: 238 gCO2e/kWhColombia: 187 gCO2e/kWhPanama: 221 gCO2e/kWhCosta Rica: 24 gCO2e/kWhNicaragua: 301 gCO2e/kWhHonduras: 322 gCO2e/kWhEl Salvador: 139 gCO2e/kWhGuatemala: 302 gCO2e/kWhBelize: 170 gCO2e/kWhVenezuela: 86 gCO2e/kWhGuyana: 645 gCO2e/kWhSuriname: 322 gCO2e/kWhFrance: 41 gCO2e/kWhEcuador: 159 gCO2e/kWhPuerto Rico: 655 gCO2e/kWhJamaica: 563 gCO2e/kWhCuba: 643 gCO2e/kWhZimbabwe: 384 gCO2e/kWhBotswana: 851 gCO2e/kWhNamibia: 49 gCO2e/kWhSenegal: 540 gCO2e/kWhMali: 539 gCO2e/kWhMauritania: 512 gCO2e/kWhBenin: 584 gCO2e/kWhNiger: 674 gCO2e/kWhNigeria: 456 gCO2e/kWhCameroon: 226 gCO2e/kWhTogo: 423 gCO2e/kWhGhana: 469 gCO2e/kWhIvory Coast: 405 gCO2e/kWhGuinea: 181 gCO2e/kWhGuinea-Bissau: 625 gCO2e/kWhLiberia: 316 gCO2e/kWhSierra Leone: 48 gCO2e/kWhBurkina Faso: 562 gCO2e/kWhCentral African Republic: 0 gCO2e/kWhRepublic of the Congo: 716 gCO2e/kWhGabon: 523 gCO2e/kWhEquatorial Guinea: 644 gCO2e/kWhZambia: 120 gCO2e/kWhMalawi: 55 gCO2e/kWhMozambique: 129 gCO2e/kWhKingdom of Eswatini: 131 gCO2e/kWhAngola: 185 gCO2e/kWhBurundi: 184 gCO2e/kWhIsrael: 493 gCO2e/kWhLebanon: 390 gCO2e/kWhMadagascar: 432 gCO2e/kWhPalestine: 414 gCO2e/kWhGambia: 667 gCO2e/kWhTunisia: 560 gCO2e/kWhAlgeria: 633 gCO2e/kWhJordan: 530 gCO2e/kWhUnited Arab Emirates: 468 gCO2e/kWhQatar: 582 gCO2e/kWhKuwait: 635 gCO2e/kWhIraq: 683 gCO2e/kWhOman: 545 gCO2e/kWhVanuatu: 500 gCO2e/kWhCambodia: 499 gCO2e/kWhThailand: 546 gCO2e/kWhLaos: 232 gCO2e/kWhMyanmar: 503 gCO2e/kWhVietnam: 461 gCO2e/kWhNorth Korea: 341 gCO2e/kWhSouth Korea: 417 gCO2e/kWhMongolia: 816 gCO2e/kWhIndia: 670 gCO2e/kWhBangladesh: 696 gCO2e/kWhBhutan: 24 gCO2e/kWhNepal: 24 gCO2e/kWhPakistan: 347 gCO2e/kWhAfghanistan: 131 gCO2e/kWhTajikistan: 73 gCO2e/kWhKyrgyzstan: 153 gCO2e/kWhTurkmenistan: 1,306 gCO2e/kWhIran: 660 gCO2e/kWhSyria: 706 gCO2e/kWhArmenia: 212 gCO2e/kWhSweden: 35 gCO2e/kWhBelarus: 309 gCO2e/kWhUkraine: no dataPoland: 589 gCO2e/kWhAustria: 117 gCO2e/kWhHungary: 163 gCO2e/kWhMoldova: 633 gCO2e/kWhRomania: 251 gCO2e/kWhLithuania: 138 gCO2e/kWhLatvia: 139 gCO2e/kWhEstonia: 319 gCO2e/kWhGermany: 330 gCO2e/kWhBulgaria: 276 gCO2e/kWhGreece: 315 gCO2e/kWhTurkey: 475 gCO2e/kWhAlbania: 25 gCO2e/kWhCroatia: 159 gCO2e/kWhSwitzerland: 39 gCO2e/kWhLuxembourg: 123 gCO2e/kWhBelgium: 150 gCO2e/kWhNetherlands: 254 gCO2e/kWhPortugal: 128 gCO2e/kWhSpain: 154 gCO2e/kWhIreland: 257 gCO2e/kWhNew Caledonia: 561 gCO2e/kWhSolomon Islands: 636 gCO2e/kWhNew Zealand: 93 gCO2e/kWhAustralia: 525 gCO2e/kWhSri Lanka: 329 gCO2e/kWhChina: 525 gCO2e/kWhTaiwan: 633 gCO2e/kWhItaly: 285 gCO2e/kWhDenmark: 114 gCO2e/kWhUnited Kingdom: 217 gCO2e/kWhIceland: 28 gCO2e/kWhAzerbaijan: 632 gCO2e/kWhGeorgia: 146 gCO2e/kWhPhilippines: 588 gCO2e/kWhMalaysia: 602 gCO2e/kWhBrunei Darussalam: 892 gCO2e/kWhSlovenia: 183 gCO2e/kWhFinland: 58 gCO2e/kWhSlovakia: 95 gCO2e/kWhCzechia: 402 gCO2e/kWhEritrea: 578 gCO2e/kWhJapan: 477 gCO2e/kWhParaguay: 25 gCO2e/kWhYemen: 592 gCO2e/kWhSaudi Arabia: 692 gCO2e/kWhNorthern Cyprus: no dataCyprus: 489 gCO2e/kWhMorocco: 596 gCO2e/kWhEgypt: 563 gCO2e/kWhLibya: 827 gCO2e/kWhEthiopia: 23 gCO2e/kWhDjibouti: 450 gCO2e/kWhSomaliland: no dataUganda: 59 gCO2e/kWhRwanda: 354 gCO2e/kWhBosnia and Herzegovina: 571 gCO2e/kWhNorth Macedonia: 441 gCO2e/kWhSerbia: 696 gCO2e/kWhMontenegro: 264 gCO2e/kWhKosovo: 901 gCO2e/kWhTrinidad and Tobago: 682 gCO2e/kWhSouth Sudan: 643 gCO2e/kWh
MapClimate

The carbon intensity of electricity

Emissions per kWh generated, life cycle assessment, in gCO2e/kWh, 2025 or latest published year

World, 2025458gCO2e/kWh

  • Norway28g
  • France41g
  • Poland589g

Why this map matters for AI

It is the main determinant of the carbon footprint of an AI: for the same computation, a server emits 14 times more in Poland than in France and 21 times more than in Norway.

From lowest to highest emitting

  • Countries with nuclear or hydro electricity (France, Sweden, Norway, Switzerland, Brazil) are the darkest.
  • The United States, which hosts more than half of the world's AI data centres, is at 384 g; China at 525 g, India at 670 g.
Assumptions and limitations

Scope. Electricity generated in the country, all power plants, emissions from construction to operation.

  • An annual, national average: intensity varies hour by hour and from one region to another within a country (US states, for example).
  • A data centre can buy renewable electricity by contract: its accounting does not necessarily follow this map.
  • Over the life cycle (Ember), the world value is 458 g: this is the value used by the AI Impact Database, the hub and the blog, the same source for all countries. The IEA, which counts only the CO2 of power plants, gives 435 g.
Ember · Climate · 169 countriesOpen the map →
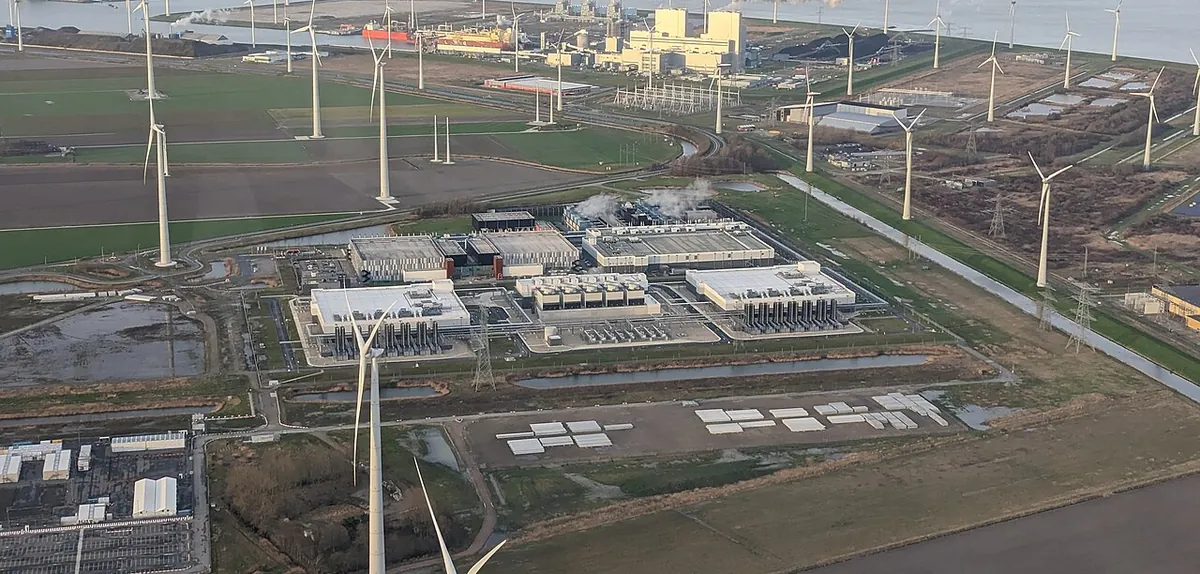
Google's data centre in Eemshaven, in the Netherlands, seen from above, surrounded by wind turbines, with industrial facilities on the horizon
Netherlands54 %Google's data centre in Eemshaven (Netherlands), in the middle of a wind farm.Photo Wvdp, Wikimedia Commons, CC0, cropped
Fiji: 64%Tanzania: 33%Western Sahara: no dataCanada: 77%United States: 43%Kazakhstan: 15%Uzbekistan: 19%Papua New Guinea: 24%Indonesia: 18%Argentina: 42%Chile: 66%DR Congo: 100%Somalia: 21%Kenya: 90%Sudan: 80%Chad: 5.4%Haiti: 19%Dominican Republic: 24%Russia: 36%Bahamas: 0.9%Falkland Islands: 0%Norway: 99%Greenland: 83%French Southern Territories: no dataTimor-Leste: 0%South Africa: 18%Lesotho: no dataMexico: 26%Uruguay: 98%Brazil: 89%Bolivia: 36%Peru: 64%Colombia: 77%Panama: 68%Costa Rica: 100%Nicaragua: 62%Honduras: 55%El Salvador: 87%Guatemala: 68%Belize: 87%Venezuela: 91%Guyana: 2.9%Suriname: 53%France: 95%Ecuador: 79%Puerto Rico: 6.4%Jamaica: 13%Cuba: 4%Zimbabwe: 57%Botswana: 0.3%Namibia: 98%Senegal: 20%Mali: 20%Mauritania: 23%Benin: 4%Niger: 3.2%Nigeria: 31%Cameroon: 73%Togo: 30%Ghana: 36%Ivory Coast: 29%Guinea: 75%Guinea-Bissau: 0%Liberia: 54%Sierra Leone: 95%Burkina Faso: 17%Central African Republic: 100%Republic of the Congo: 21%Gabon: 35%Equatorial Guinea: 27%Zambia: 88%Malawi: 96%Mozambique: 83%Kingdom of Eswatini: 97%Angola: 74%Burundi: 76%Israel: 17%Lebanon: 44%Madagascar: 42%Palestine: 39%Gambia: 0%Tunisia: 4%Algeria: 1.1%Jordan: 24%United Arab Emirates: 32%Qatar: 4.1%Kuwait: 2.2%Iraq: 1.6%Oman: 4.5%Vanuatu: 25%Cambodia: 41%Thailand: 17%Laos: 77%Myanmar: 48%Vietnam: 45%North Korea: 63%South Korea: 40%Mongolia: 8.4%India: 27%Bangladesh: 2.1%Bhutan: 100%Nepal: 100%Pakistan: 55%Afghanistan: 87%Tajikistan: 94%Kyrgyzstan: 85%Turkmenistan: 0%Iran: 5.7%Syria: 3.5%Armenia: 66%Sweden: 99%Belarus: 41%Ukraine: no dataPoland: 32%Austria: 84%Hungary: 75%Moldova: 11%Romania: 68%Lithuania: 78%Latvia: 73%Estonia: 60%Germany: 59%Bulgaria: 72%Greece: 50%Turkey: 43%Albania: 100%Croatia: 76%Switzerland: 98%Luxembourg: 92%Belgium: 72%Netherlands: 54%Portugal: 81%Spain: 75%Ireland: 48%New Caledonia: 27%Solomon Islands: 9.1%New Zealand: 89%Australia: 39%Sri Lanka: 62%China: 42%Taiwan: 13%Italy: 49%Denmark: 91%United Kingdom: 64%Iceland: 100%Azerbaijan: 12%Georgia: 80%Philippines: 23%Malaysia: 21%Brunei Darussalam: 0.2%Slovenia: 79%Finland: 96%Slovakia: 85%Czechia: 59%Eritrea: 11%Japan: 33%Paraguay: 100%Yemen: 11%Saudi Arabia: 2.2%Northern Cyprus: no dataCyprus: 28%Morocco: 24%Egypt: 13%Libya: 0%Ethiopia: 100%Djibouti: 35%Somaliland: no dataUganda: 97%Rwanda: 50%Bosnia and Herzegovina: 44%North Macedonia: 47%Serbia: 28%Montenegro: 76%Kosovo: 11%Trinidad and Tobago: 0.1%South Sudan: 1.8%
MapElectricity

The share of low-carbon electricity

Share of nuclear and renewables in electricity generated, in %, 2025 or latest published year

World, 202543%

  • Norway99%
  • France95%
  • United States43%

Why this map matters for AI

Data centres look for abundant, low-carbon electricity. Where it exists, they compete with the electrification of transport, heating and industry.

Comparison of 4 countries

  • France is at 95%, Norway at 99%, the United States at 43%, China at 42%.
  • This map is the mirror of the carbon intensity map: the higher the low-carbon share, the lower the intensity.
Assumptions and limitations

Scope. Electricity generated in the country: nuclear, hydro, wind, solar, bioenergy.

  • The share of electricity generated, not consumed: trade between countries is not counted.
  • Low-carbon electricity can be scarce: a high share does not mean there is capacity left for new centres.
Ember · Electricity · 164 countriesOpen the map →
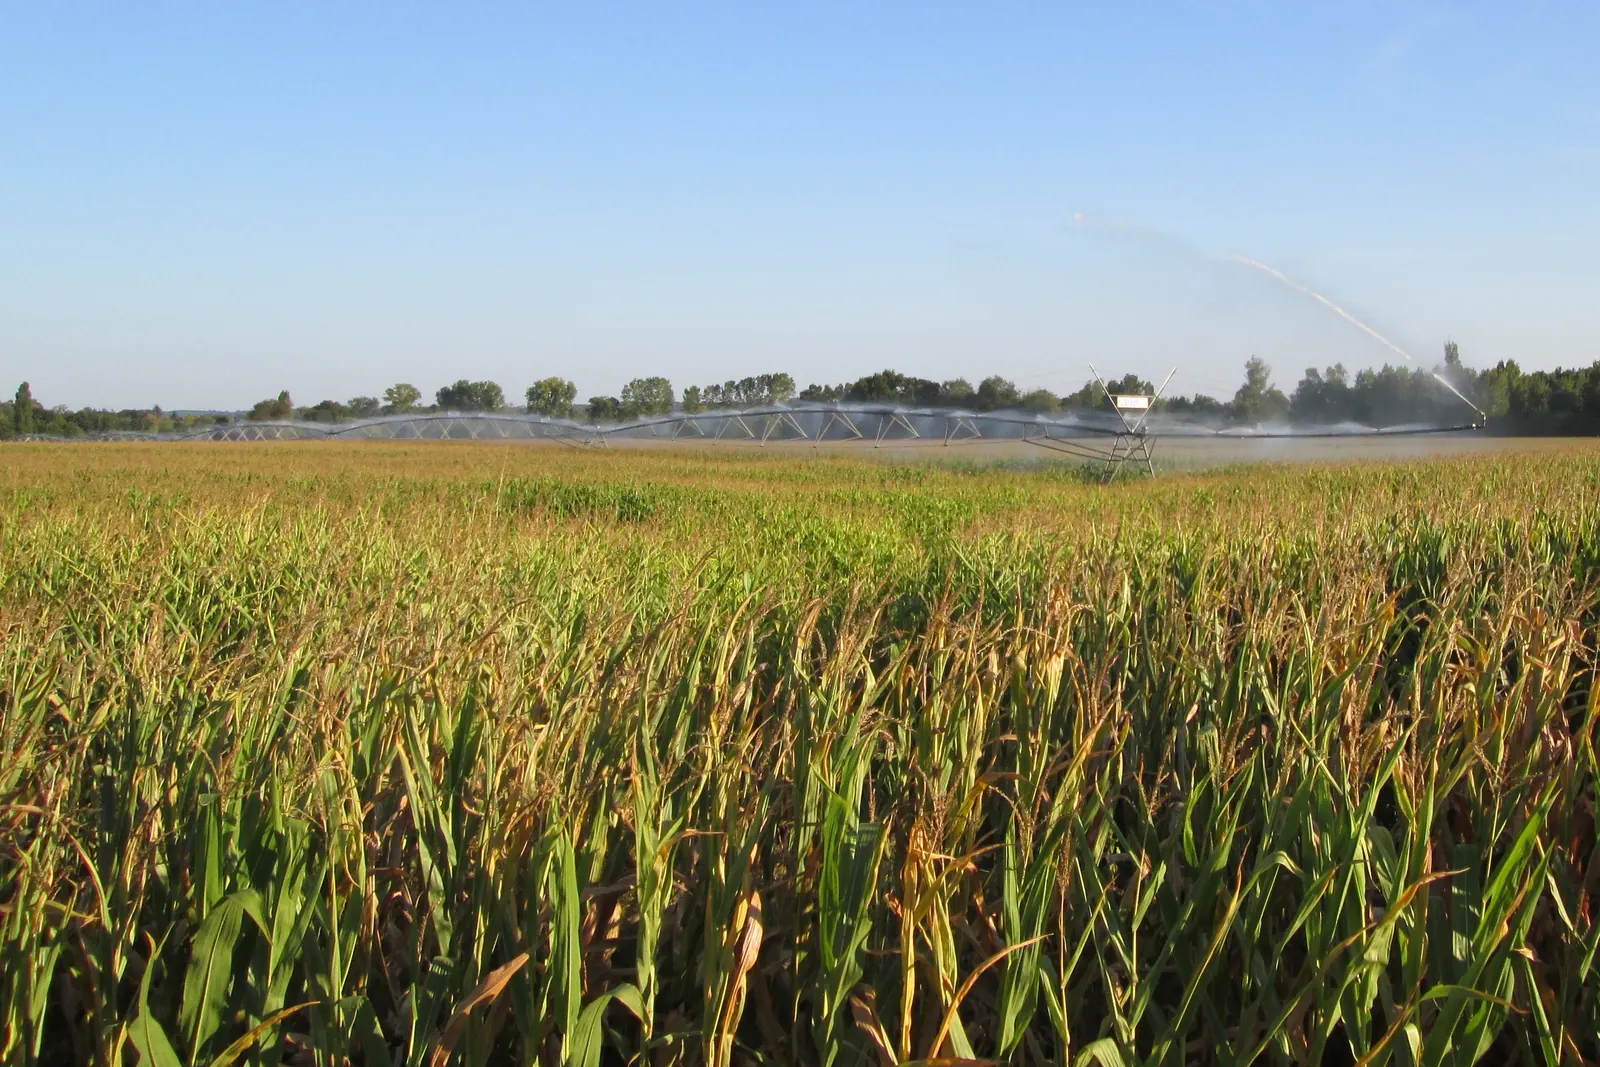
A centre-pivot irrigation rig watering a maize field in Dordogne, under a blue sky
France21 %Irrigation of a maize field in Dordogne, in 2014.Photo Cjp24, Wikimedia Commons, CC BY-SA 4.0, cropped
Fiji: 0.6%Tanzania: 13%Western Sahara: no dataCanada: 3.7%United States: 25%Kazakhstan: 34%Uzbekistan: 123%Papua New Guinea: 0.1%Indonesia: 30%Argentina: 11%Chile: 9%DR Congo: 0.2%Somalia: 25%Kenya: 11%Sudan: 119%Chad: 4.3%Haiti: 13%Dominican Republic: 40%Russia: 4.2%Bahamas: no dataFalkland Islands: no dataNorway: 2%Greenland: no dataFrench Southern Territories: no dataTimor-Leste: 28%South Africa: 68%Lesotho: 2.6%Mexico: 45%Uruguay: 12%Brazil: 1.4%Bolivia: 0.2%Peru: 3.6%Colombia: 3.7%Panama: 0.9%Costa Rica: 5.9%Nicaragua: 2.2%Honduras: 4.6%El Salvador: 13%Guatemala: 5.7%Belize: 0.1%Venezuela: 7.5%Guyana: 0.3%Suriname: 4%France: 21%Ecuador: 1.1%Puerto Rico: 20%Jamaica: 12%Cuba: 22%Zimbabwe: 46%Botswana: 2.3%Namibia: 0.3%Senegal: 16%Mali: 43%Mauritania: 13%Benin: 1%Niger: 11%Nigeria: 30%Cameroon: 1.6%Togo: 3.4%Ghana: 0.5%Ivory Coast: 5.1%Guinea: 1.4%Guinea-Bissau: 1.5%Liberia: 0.3%Sierra Leone: 0.5%Burkina Faso: 1.3%Central African Republic: 0.3%Republic of the Congo: 0%Gabon: 0.5%Equatorial Guinea: 0.2%Zambia: 8.6%Malawi: 4.1%Mozambique: 1.8%Kingdom of Eswatini: 78%Angola: 1.9%Burundi: 10%Israel: 120%Lebanon: 59%Madagascar: 25%Palestine: 45%Gambia: 2.2%Tunisia: 97%Algeria: 145%Jordan: 105%United Arab Emirates: 1,437%Qatar: 431%Kuwait: 3,851%Iraq: 68%Oman: 117%Vanuatu: no dataCambodia: 1%Thailand: 22%Laos: 4.8%Myanmar: 5.8%Vietnam: 18%North Korea: 28%South Korea: 85%Mongolia: 5%India: 66%Bangladesh: 5.7%Bhutan: 1.4%Nepal: 8.3%Pakistan: 98%Afghanistan: 55%Tajikistan: 70%Kyrgyzstan: 50%Turkmenistan: 135%Iran: 80%Syria: 124%Armenia: 62%Sweden: 3.6%Belarus: 4.7%Ukraine: 7.3%Poland: 33%Austria: 8.7%Hungary: 7.6%Moldova: 12%Romania: 7.5%Lithuania: 2.2%Latvia: 1%Estonia: 8.6%Germany: 32%Bulgaria: 39%Greece: 18%Turkey: 48%Albania: 4.8%Croatia: 1.6%Switzerland: 6.5%Luxembourg: 4%Belgium: 53%Netherlands: 15%Portugal: 12%Spain: 43%Ireland: 9.4%New Caledonia: no dataSolomon Islands: no dataNew Zealand: 8.1%Australia: 4.2%Sri Lanka: 91%China: 42%Taiwan: no dataItaly: 30%Denmark: 27%United Kingdom: 14%Iceland: 0.4%Azerbaijan: 58%Georgia: 4.2%Philippines: 28%Malaysia: 3.4%Brunei Darussalam: 3.5%Slovenia: 6.4%Finland: 7.1%Slovakia: 2.4%Czechia: 20%Eritrea: 11%Japan: 35%Paraguay: 1.8%Yemen: 282%Saudi Arabia: 974%Northern Cyprus: no dataCyprus: 31%Morocco: 19%Egypt: 113%Libya: 817%Ethiopia: 32%Djibouti: 6.3%Somaliland: no dataUganda: 5.8%Rwanda: 6.6%Bosnia and Herzegovina: 2.1%North Macedonia: 66%Serbia: 5.8%Montenegro: no dataKosovo: no dataTrinidad and Tobago: 20%South Sudan: 4.2%
MapWater

Water stress, country by country

Freshwater withdrawals as a share of available resources, in %, 2023

World, 202318%

  • France21%
  • Spain43%
  • India66%

Why this map matters for AI

The volume of water of a data centre matters less than its location. Where withdrawals approach or exceed resources, every m³ evaporated by cooling weighs on agriculture and drinking water.

The 5 FAO levels

  • The FAO distinguishes 5 levels: no stress below 25%, low from 25 to 50%, medium from 50 to 75%, high from 75 to 100%, critical above that.
  • Above 100%, a country draws on non-renewable groundwater or desalinates seawater: this is the case for Saudi Arabia and Egypt.
Assumptions and limitations

Scope. All freshwater withdrawals of the country (agriculture, industry, domestic uses), as a share of renewable resources, after the needs of ecosystems.

  • A national average: stress plays out basin by basin. The United States (25%) has regions under critical stress, such as Arizona.
  • The indicator counts withdrawals, not consumption: water returned to the environment is included.
FAO · Water · 162 countriesOpen the map →

Compare countries

A question about a figure?

An error, a source to add, a methodology question, a press request: write to us. Guillaume Pakula, Clément Reynaud, Sébastien Pierfederici and Alexandre Veilly will reply.

Write to us →

Projet Celsius, which runs this hub, also helps companies measure and reduce the footprint of their AI use.

Accounting for AI in your Bilan Carbone® ↗
Projet Celsius, environmental strategy consultancy

We support companies that account for AI in their Bilan Carbone®

Visiter Projet Celsius ↗