


AI and society
AI also changes work, learning and public debate. These effects are harder to measure than electricity: studies on employment mostly measure the exposure of occupations, not yet the net effects.
By Projet Celsius
Charts and maps of the topic
Charts and maps →Focus area
ChartWorld · 2024 and 2025Jobs exposed to AI604026IMF342411ILO60%IMF, advanced economiesIMF, 2024; ILO, 2025ChartCountries · 2023 and 2025People in France and generative AI20 %202348 %202585 %18-24 year-olds48%aged 12 and over, in 2025Baromètre du numérique 2026ChartWorld · 2025 to 2030Jobs created and lost by 2030Total, created170 MTotal, eliminated92 MAI, created11 MAI, eliminated9 M11millionjobs created by AI by 2030, 9 million eliminatedWorld Economic Forum, 2025
Analyses and articles
Analyses
 Viewpoint
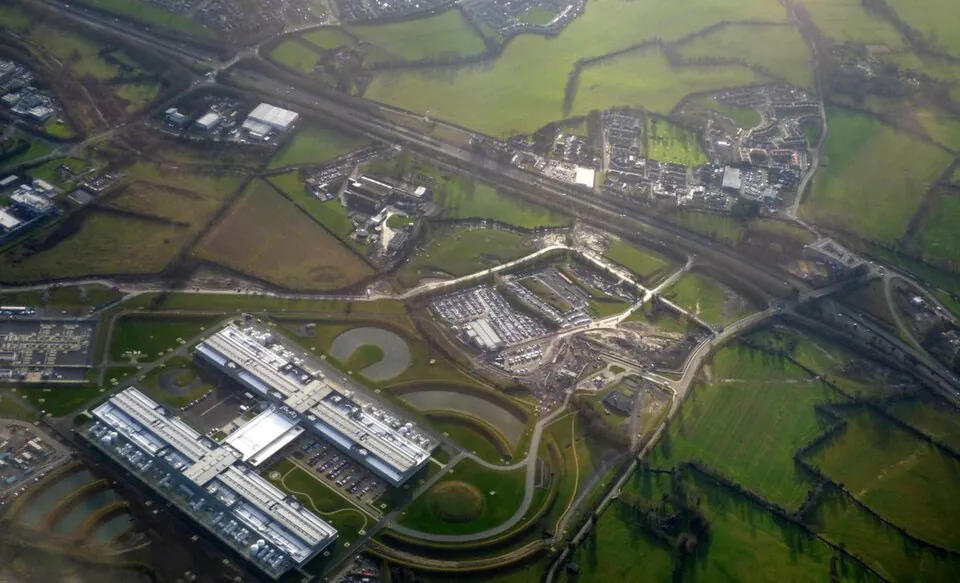
 Society20 October 2026Surface AI and deep AIPublic debate looks at the AI people can see, the AI of chat windows. Its footprint is decided almost entirely below the surface, in an AI with no interface that can only be detected through the electricity grid.
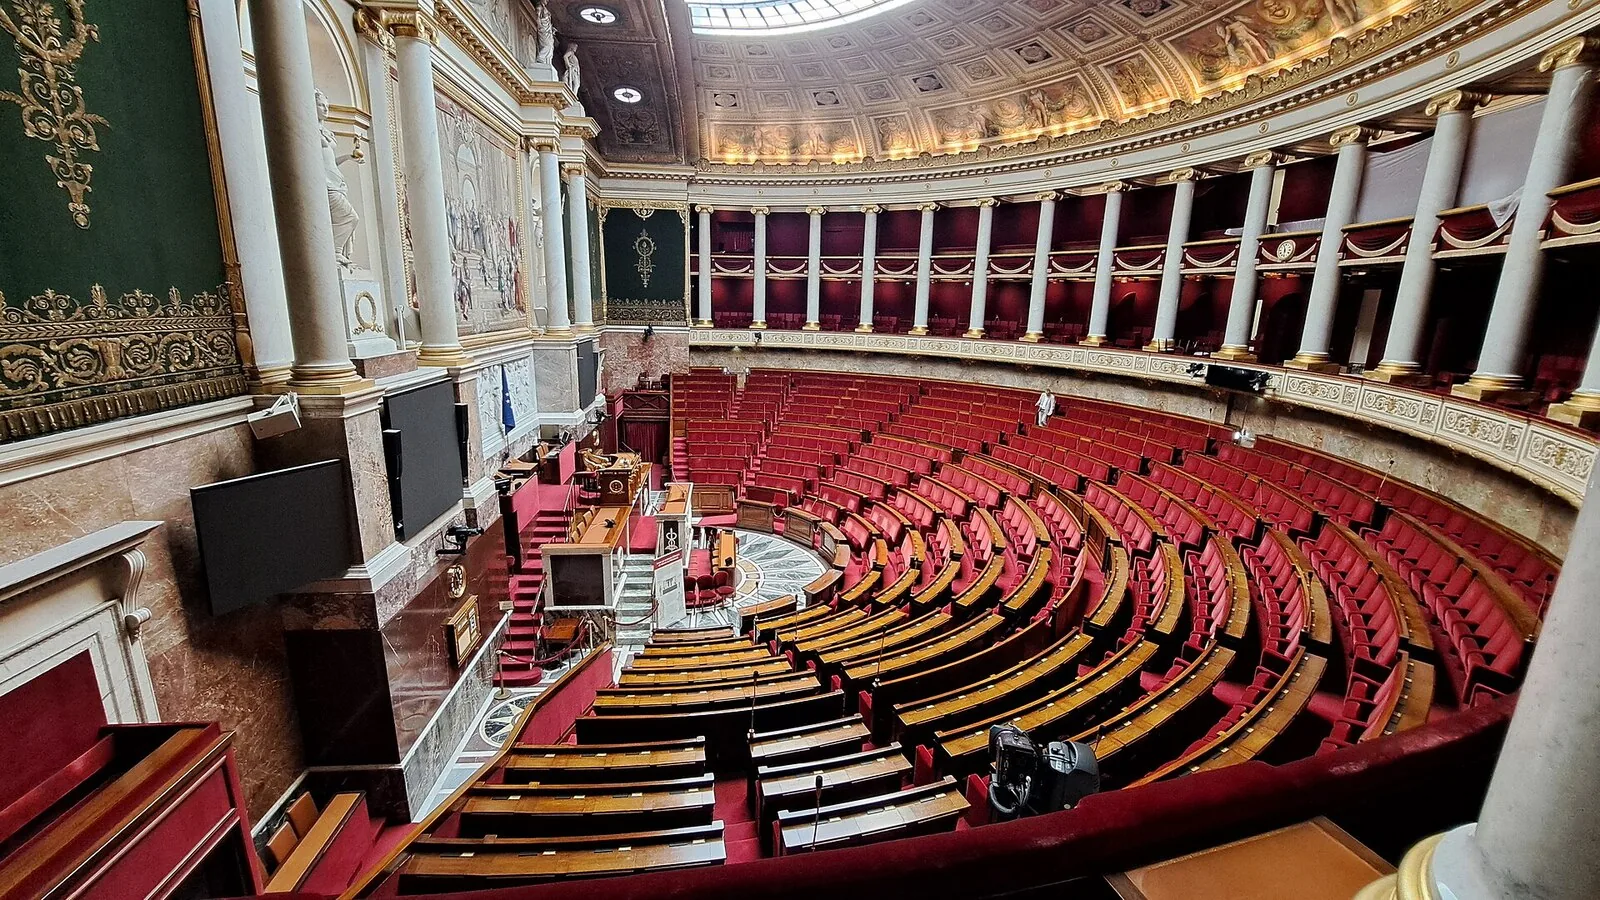 AnalysisSociety12 November 2026Does AI really make us more productive at work?AI saves time for the people who use it, yet that time is almost impossible to find in the accounts of companies and countries. Speaking to French MPs, the head of Mistral AI unintentionally offered one way of explaining the gap.
On the Projet Celsius blog ↗

Sources for this topic
- IMF, Gen-AI: Artificial Intelligence and the Future of Work, Staff Discussion Note SDN/2024/001, January 2024 ↗
- ILO, Generative AI and Jobs: A Refined Global Index of Occupational Exposure, Working Paper 140, May 2025 ↗
- World Economic Forum, Future of Jobs Report 2025, January 2025 ↗
- Arcep, Arcom, CGE and ANCT, Baromètre du numérique, 2026 edition ↗
Across the hub
 AI Impact DatabaseAll the figures, their methodology and their sources.
 AI Ranking10 assistants rated out of 100: performance, ethics and environment.


 AnalysesThe signed pieces: analyses, viewpoints, "Where does this figure come from?".
 Charts and mapsThe reference visuals, with their data and sources.
 ToolsOpen calculations, your assumptions on the left, the result on the right.






A question about a figure?
An error, a source to add, a methodology question, a press request: write to us. Guillaume Pakula, Clément Reynaud, Sébastien Pierfederici and Alexandre Veilly will reply.
Write to us →
Projet Celsius, which runs this hub, also helps companies measure and reduce the footprint of their AI use.
Accounting for AI in your Bilan Carbone® ↗





