

Tools
Open calculations: your assumptions on the left, the result on the right, and each value linked to its entry and its source.
The hub tools
 Example result 10 questions a day, 5 images and 1 video a week, global average electricity 6.5kWh 3kgCO2e Where the electricity comes from Questions1.1 kWh17 %Images756 Wh12 %Videos4.7 kWh72 % Tool
 Uses Estimate the footprint of your AI use Questions, images, videos: the electricity and CO2e of a year, based on your assumptions. Your assumptions Questions per day · In reasoning mode · Images per week · Videos per week · Video generator · Server electricity The result Your uses over a year, in kWh and kgCO2e, compared with everyday reference points. Open the tool →
21times as much Poland (3.8 kgCO2e) versus Norway (180 gCO2e), for 1 year of regular use Poland3.8 kg World3 kg United States2.5 kg Germany2.2 kg Ireland1.7 kg Netherlands1.7 kg European Union1.4 kg Finland380 g France270 g Switzerland260 g Sweden230 g Norway180 g Tool Climate Compare the footprint of an AI use by the country where the servers are The same use, converted into CO2e with the electricity of 12 countries and regions. One task, 12 electricity grids: up to 21 times difference for the same calculation, between Norway and Poland. Open the tool 16reference points From 0.3 Wh to 28,200 TWh, on a single logarithmic scale A text question to an AI0.3 Wh A year of regular AI use6.5 kWh ChatGPT, a year of questions323 GWh Data centres worldwide, 2025485 TWh All the world's electricity, 202528,200 TWh 1 Wh1 kWh1 MWh1 GWh1 TWh1,000 TWh Logarithmic scale: each tick multiplies by 1,000 Tool
 Electricity Browse the orders of magnitude of electricity use, from one question to the planet An electricity scale, from the watt-hour of a question to the terawatt-hours of the world. 16 sourced reference points, on a single scale. Open the tool
Climate Compare the footprint of an AI use by the country where the servers are The same use, converted into CO2e with the electricity of 12 countries and regions. One task, 12 electricity grids: up to 21 times difference for the same calculation, between Norway and Poland. Open the tool 16reference points From 0.3 Wh to 28,200 TWh, on a single logarithmic scale A text question to an AI0.3 Wh A year of regular AI use6.5 kWh ChatGPT, a year of questions323 GWh Data centres worldwide, 2025485 TWh All the world's electricity, 202528,200 TWh 1 Wh1 kWh1 MWh1 GWh1 TWh1,000 TWh Logarithmic scale: each tick multiplies by 1,000 ToolElectricity Browse the orders of magnitude of electricity use, from one question to the planet An electricity scale, from the watt-hour of a question to the terawatt-hours of the world. 16 sourced reference points, on a single scale. Open the tool 


 GPT-6 Astra
 Gemini 3.1 Pro
 Claude Opus 5.5
 Mistral Large 4
A single database
The hub tools read the same database as the charts and the articles.
481verified values
Each with its source, its page and its scope.
76sources
Each read in the original document.
Each value is verified a second time, independently of the first reading, by reopening the source.
MethodologyOn the Projet Celsius blog ↗
 Blog article ↗Should we boycott AI?Environment, culture, jobs: the arguments weighed one by one.↗
 Blog article ↗Which green AI to choose?Light models, hosting, electricity grid: the criteria that matter.↗
 Blog article ↗Which AI should you choose to pollute the least?Comparing models when each provider measures in its own way.↗
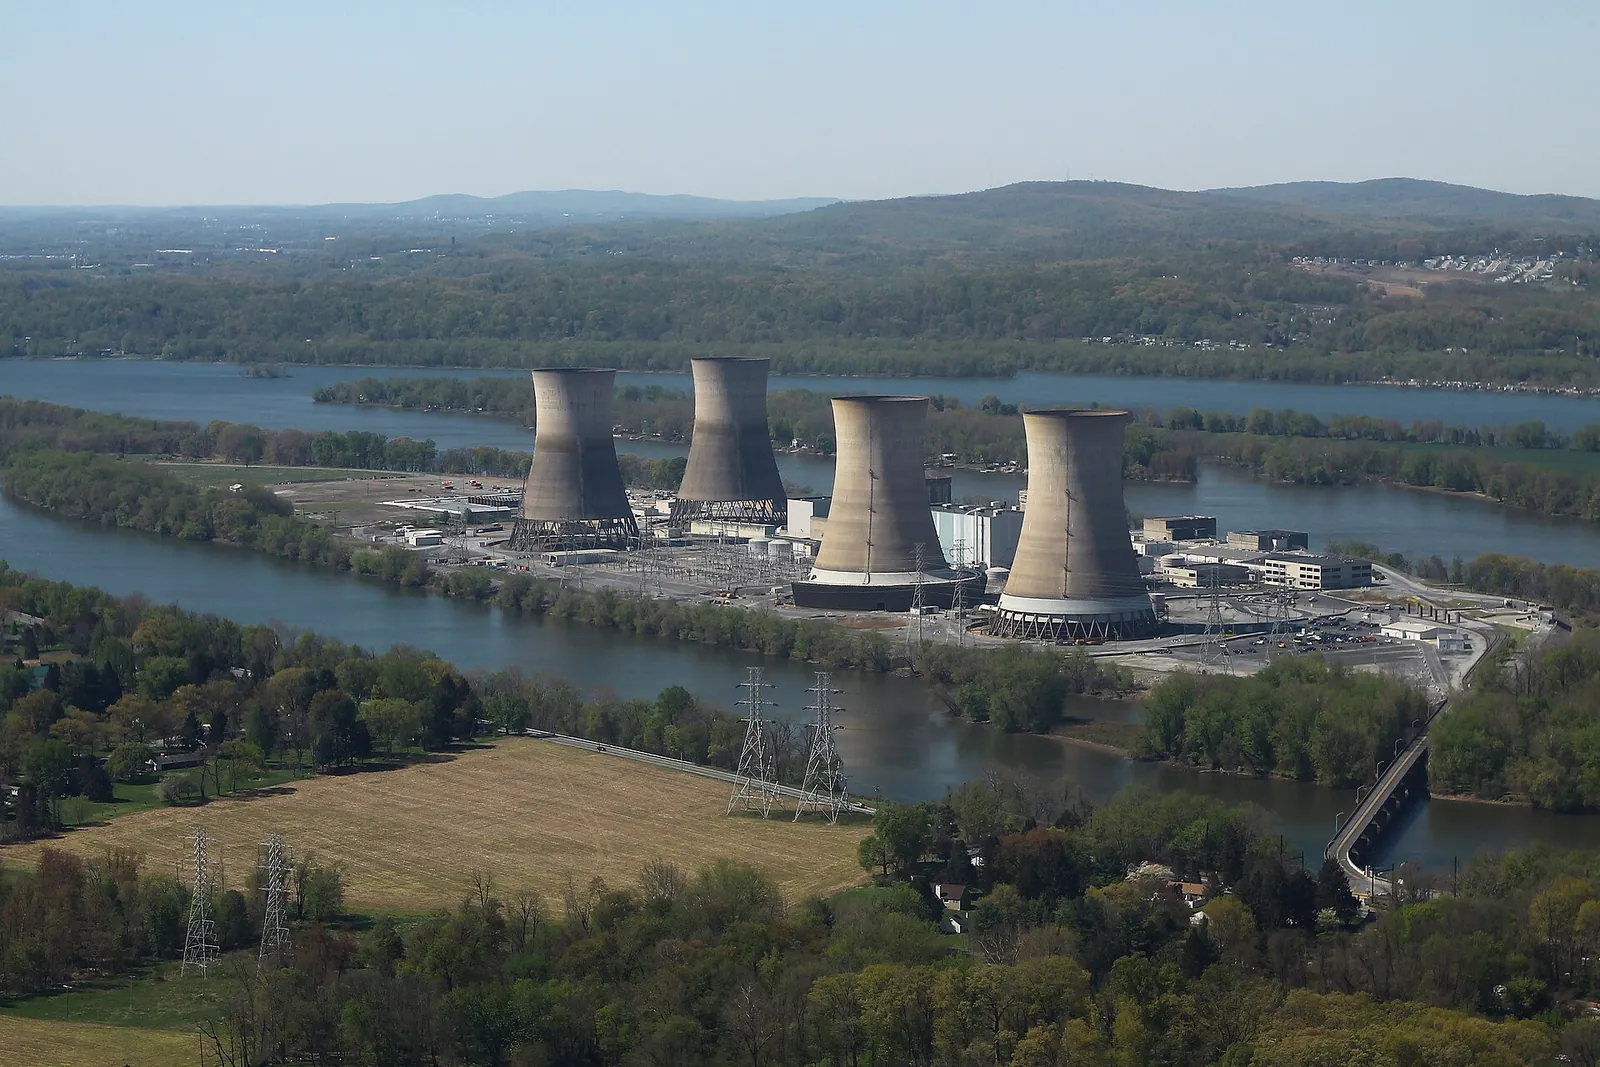 Blog article ↗How much electricity does AI consume?From chips to grids: what data centres consume and what drives the increase.↗
Across the hub
 AI Impact DatabaseAll the figures, their methodology and their sources.
 AI Ranking10 assistants rated out of 100: performance, ethics and environment.


 AnalysesThe signed pieces: analyses, viewpoints, "Where does this figure come from?".
 Charts and mapsThe reference visuals, with their data and sources.
 ToolsYou are hereOpen calculations, your assumptions on the left, the result on the right.






A question about a figure?
An error, a source to add, a methodology question, a press request: write to us. Guillaume Pakula, Clément Reynaud, Sébastien Pierfederici and Alexandre Veilly will reply.
Write to us →
Projet Celsius, which runs this hub, also helps companies measure and reduce the footprint of their AI use.
Accounting for AI in your Bilan Carbone® ↗





