

Compare the footprint of an AI use by the country where the servers are
The same use, converted into CO2e with the electricity of 12 countries and regions.
- Calculation
- On the AI Impact Database, its factors and its inputs
- Published
- 20 October 2026, CC BY 4.0 licence
1
Your use
The task to convertSame task, same energy in the 12 countries
1,000 written questions300Wh100 images291Wh10 videos of 5 seconds900Wh1 year of regular use6.5kWh
2
Your assumptions
Electricity of the 12 countries and regionsIn gCO2e per kWh, 2025, over the life cycle (Ember)
Poland589 gWorld (default)458 gUnited States384 gGermany330 gIreland257 gNetherlands254 gEuropean Union210 gFinland57.5 gFrance41.4 gSwitzerland39.2 gSweden35.3 gNorway28.1 g
Default : 1 year of regular use (10 questions a day, 5 images and 1 video a week), and the global average.
3
Results, country by country
Gap21times as much589 g versus 28.1 g per kWh
The most carbon-intensive3.8kgCO2e6.5 kWh x 589 g per kWh
The lowest180gCO2e6.5 kWh x 28.1 g per kWh
The same use, 12 electricity grids
Poland589 g per kWh3.8kgCO2e
Worlddefault · 458 g per kWh3kgCO2e
United States384 g per kWh2.5kgCO2e
Germany330 g per kWh2.2kgCO2e
Ireland257 g per kWh1.7kgCO2e
Netherlands254 g per kWh1.7kgCO2e
European Union210 g per kWh1.4kgCO2e
Finland57.5 g per kWh380gCO2e
France41.4 g per kWh270gCO2e
Switzerland39.2 g per kWh260gCO2e
Sweden35.3 g per kWh230gCO2e
Norway28.1 g per kWh180gCO2e

Assumptions and sources
6.5 kWh1 year of regular useAI Impact Database28.1 to 589 g per kWhfrom Norway to Poland, 2025Ember180 gCO2e to 3.8 kgCO2ea gap of 21 times
Not countedRenewable electricity contracts
The calculation in detail
The values and the limits
The values used
- 1,000 written questions
- 300 Wh
- 100 images
- 291 Wh
- 10 videos of 5 seconds
- 900 Wh
- 1 year of regular use
- 6.5 kWh
- Electricity of countries
- Ember, 2025
The limits of the calculation
- Average annual intensity of the electricity produced in the country, and worldwide (Ember, life cycle, 2025: the same source for all, that of the AI Impact Database).
- A data centre can buy renewable electricity by contract; this calculation follows the real grid.
- The large assistants do not say where their servers run: more than half of AI data centres are in the United States, according to GreenIT.
The 5 sources
One line per document
- 1Ember, Global Electricity Review 2026, and annual data via Our World in Data
- 2Our World in Data, based on Ember, Lifecycle carbon intensity of electricity
- 3Epoch AI, How much energy does ChatGPT use?, February 2025
- 4Luccioni, Jernite and Strubell, Power Hungry Processing: Watts Driving the Cost of AI Deployment?, 2024
- 5Delavande, Pierrard and Luccioni, Video Killed the Energy Budget, September 2025
More on climate
The whole Climate topic →Charts and maps
Chart ClimateElectricity emissions, by contract or by grid1 to 4,400the same scope 2 at Meta, depending on the methodKey figureClimateCarbon intensity of electricity in FranceFrance · 2025 · life cycle · EmberChartClimateGoogle and Microsoft emissions58 to 81%rise in emissions since the baseline yearChartClimateOne question, 4 ways of counting CO2eover90timesgap between the lowest and the highest
ClimateElectricity emissions, by contract or by grid1 to 4,400the same scope 2 at Meta, depending on the methodKey figureClimateCarbon intensity of electricity in FranceFrance · 2025 · life cycle · EmberChart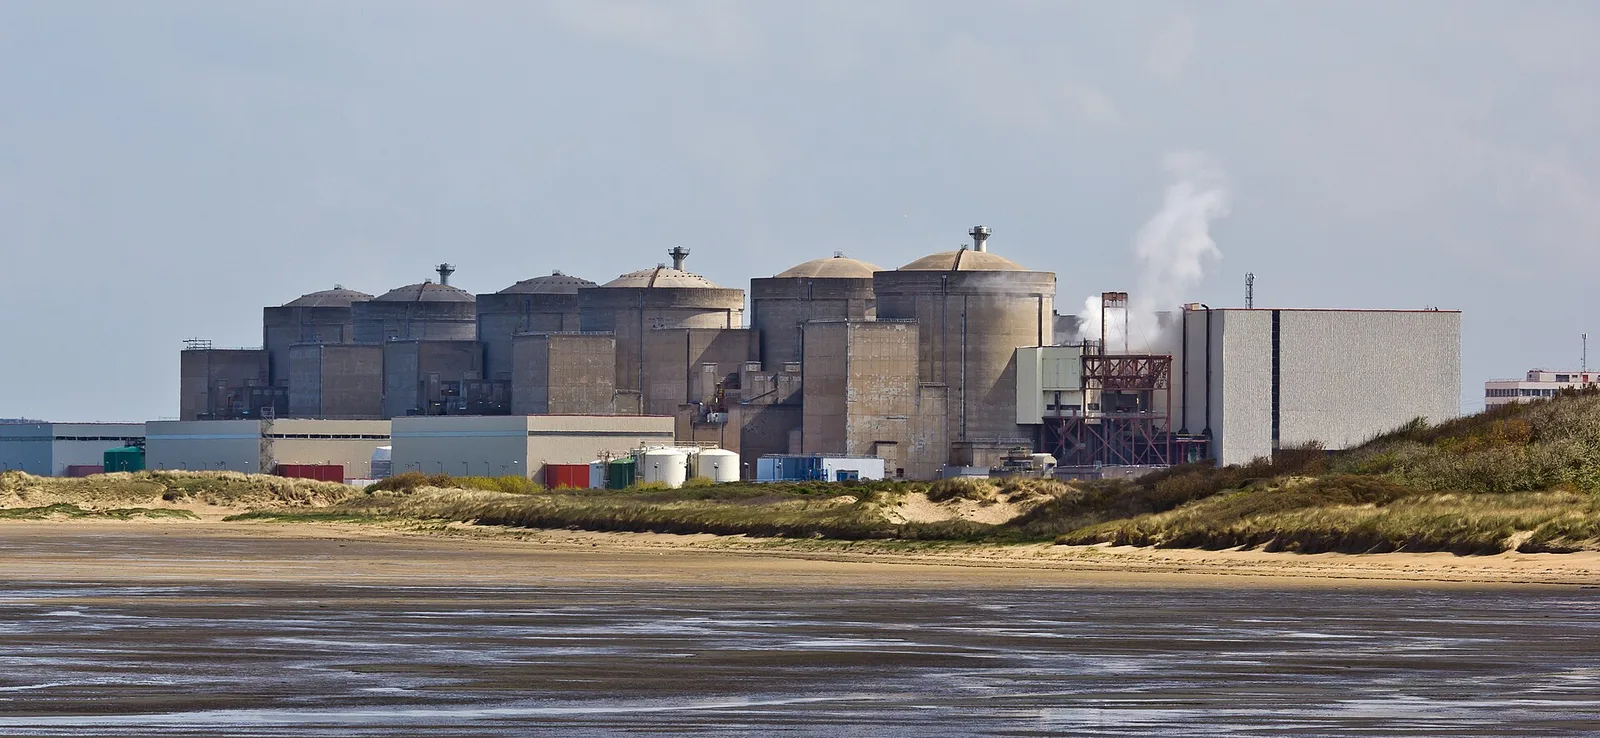 ClimateGoogle and Microsoft emissions58 to 81%rise in emissions since the baseline yearChartClimateOne question, 4 ways of counting CO2eover90timesgap between the lowest and the highest
Analyses
 AnalysisClimate12 November 2026Why do estimates of AI's impact differ?Calculated with French electricity, one question to an AI emits 0.012 gram of CO2e; Mistral AI publishes 1.14 gram, more than 90 times as much. Its water use ranges from 0.26 to 45 millilitres depending on the published measurements. These figures are accurate; they do not cover the same scope.
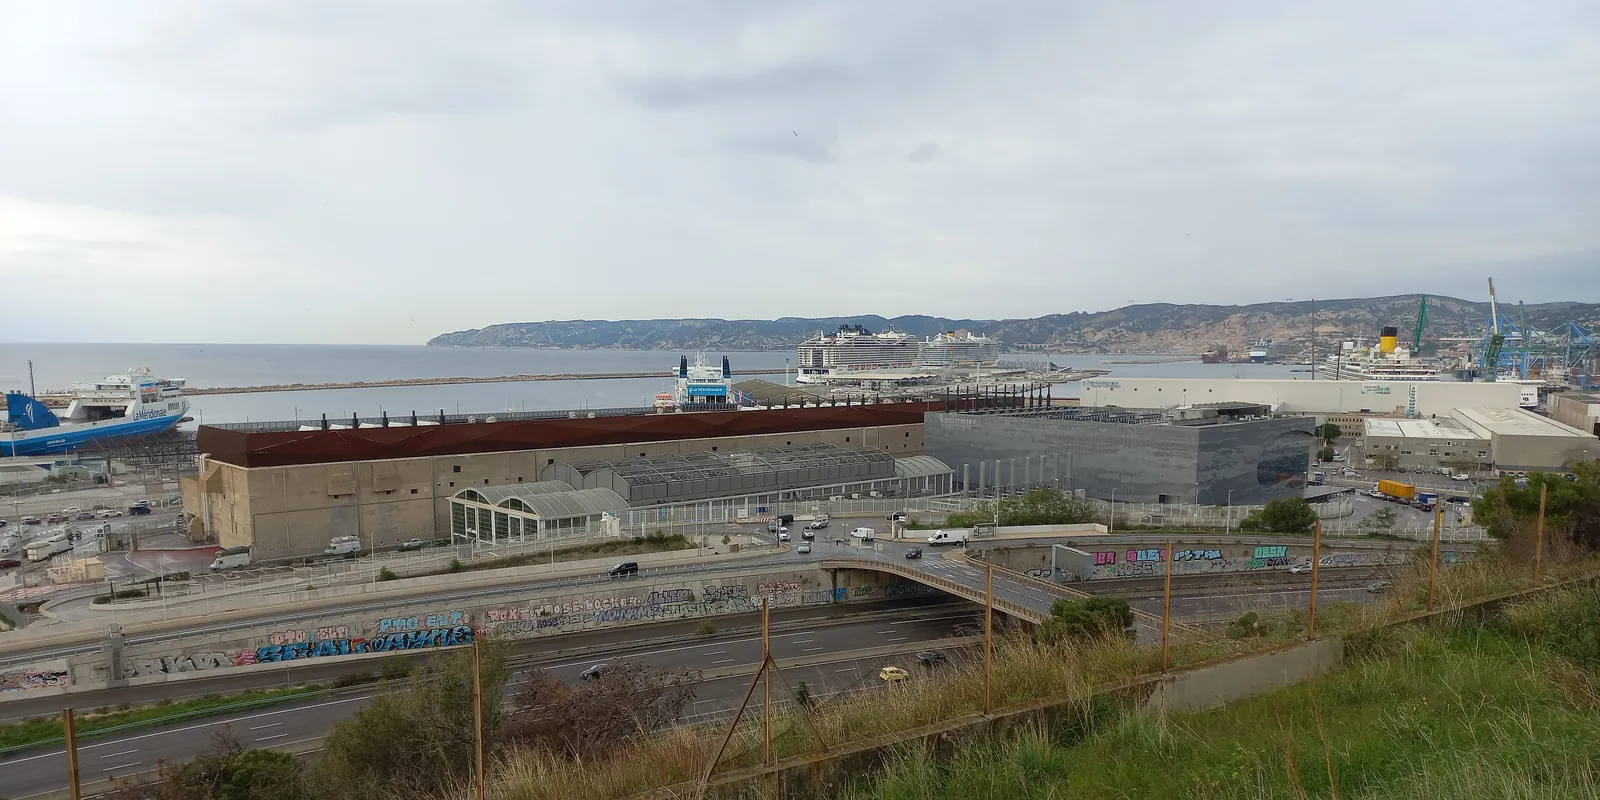 Where does this figure come from?Climate20 October 2026"Meta's electricity emits only 1,358 tonnes of CO2e"In 2024, Meta reports 1,358 tonnes of CO2e for the electricity it buys, the annual footprint of 170 people in France. The same report also gives 5.97 million tonnes. Both of the 2 figures are accurate.
On the Projet Celsius blog ↗
 Uses
 Electricity
Across the hub
 AI Impact DatabaseAll the figures, their methodology and their sources.
 AI Ranking10 assistants rated out of 100: performance, ethics and environment.


 AnalysesThe signed pieces: analyses, viewpoints, "Where does this figure come from?".
 Charts and mapsThe reference visuals, with their data and sources.
 ToolsYou are hereOpen calculations, your assumptions on the left, the result on the right.






A question about a figure?
An error, a source to add, a methodology question, a press request: write to us. Guillaume Pakula, Clément Reynaud, Sébastien Pierfederici and Alexandre Veilly will reply.
Write to us →
Projet Celsius, which runs this hub, also helps companies measure and reduce the footprint of their AI use.
Accounting for AI in your Bilan Carbone® ↗





