Key figureClimateUpdated on 11 November 2026

41.4gCO2e/kWh

Carbon intensity of electricity in France

France · 2025 · life cycle · Ember

Producing 1 kWh of electricity emits 41.4 gCO2e in France in 2025, over its life cycle, according to Ember, about 11 times less than the global average.

ADEME publishes 51.9 g (Base Carbone, electricity 2024, consumption mix) and RTE 19.6 g (direct emissions, 2025): three scopes, three values.
See the source
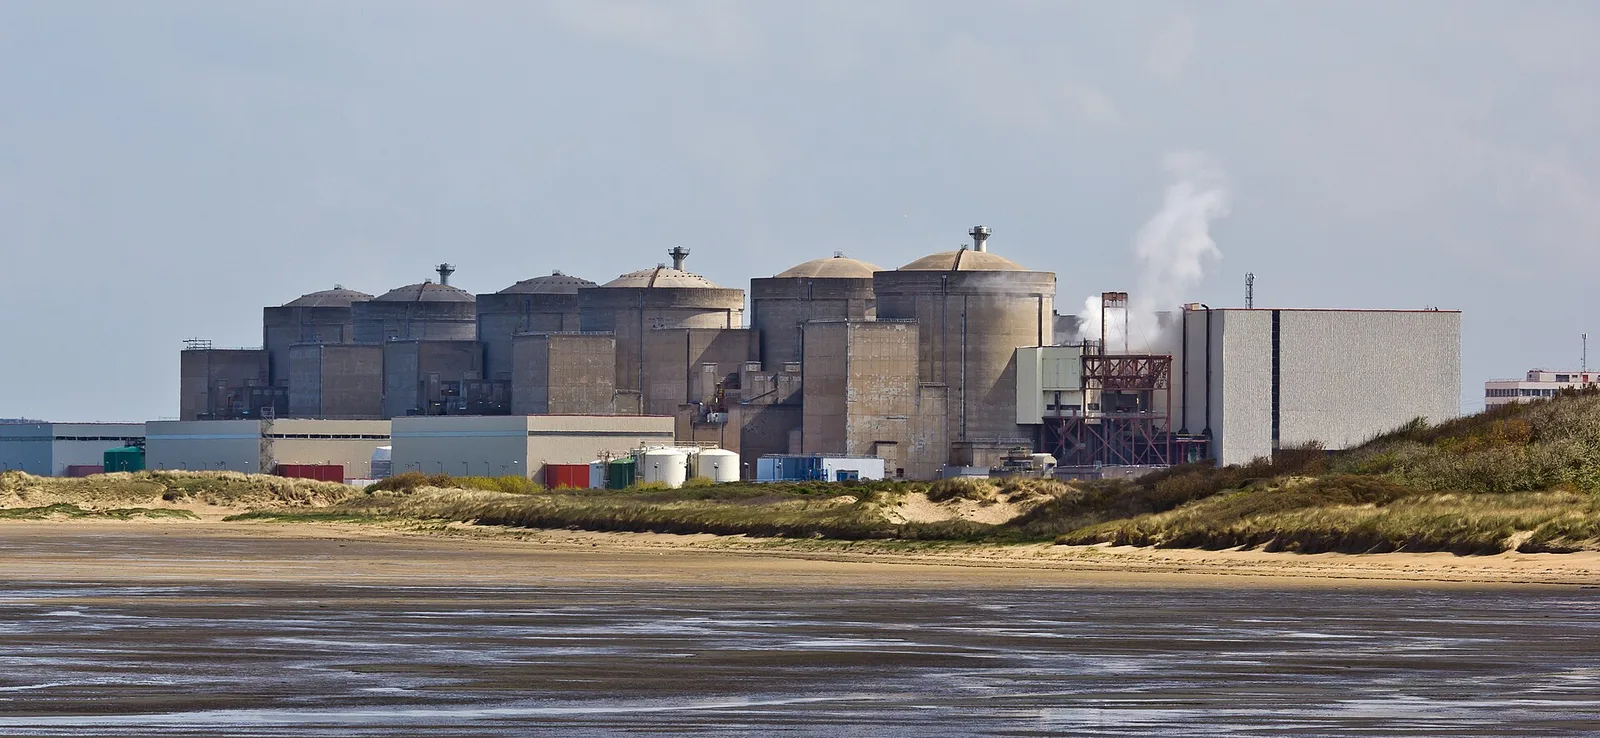
The Gravelines nuclear power plant seen from the sea
The Gravelines nuclear power plant, in northern France, seen from the sea. Photo Raimond Spekking, Wikimedia Commons, CC BY-SA 4.0

Definition and scope

Greenhouse gas emissions of one kilowatt-hour of electricity produced in France in 2025, in life cycle assessment, according to Ember: the same source as for the world and the other countries.

What is included

  • Production, over the life cycle (construction of power plants, fuels)

What is excluded

  • Imports: this is the electricity produced, not consumed
  • Variations from one hour or one season to another

How the value is obtained

Value from Ember, reused by Our World in Data: the AI Impact Database takes a single source for all countries. The hub uses it when the servers are assumed to be in France. In an emissions footprint, the reference is ADEME's Base Carbone.

Limits and uncertainties

  • The large assistants do not run their servers in France, with a few exceptions: the value serves mostly as a lower bound.
  • The 3 sources give 3 values: a calculation must say which one it uses.

The order of magnitude

All figures

41.4 gCO2e/kWh on a carbon intensity scale, with another reference figure and 10 values from the linked chart, brought to the same unit. Each tick multiplies by 10.

10 gCO2e/kWh100 gCO2e/kWh1,000 gCO2e/kWh41.4 gCO2e/kWhElectricity in France28.1Norway35.3Sweden39.2Switzerland57.5Finland210European Union254Netherlands257Ireland330Germany384United States458 gCO2e/kWhGlobal electricity589Poland
1,000 gCO2e/kWh589Poland458 gCO2e/kWhGlobal electricity384United States330Germany257Ireland254Netherlands210European Union57.5Finland41.4 gCO2e/kWhElectricity in France39.2Switzerland35.3Sweden28.1Norway
This figureAnother reference figure (link to its entry)A value from the chart "Server electricity, country by country"Logarithmic scale

Server electricity, country by country

Carbon intensity of electricity generated in 2025, life cycle, in gCO2e/kWh

2025

The same calculation emits 14 times more in Poland than in France, and 21 times more than in Norway.

0200400600Norway28.1Sweden35.3Switzerland39.2France41.4Finland57.5European Union210Netherlands254Ireland257Germany330United States384World458Poland58914 times France
Source: Ember, 2026, via Our World in Data · projetcelsius.com/en/ai · CC BY 4.0AI Impactby Projet Celsius

Update history

The hub changelog
Answer sentence added at the top of the entry
The entry reads the AI Impact Database: Ember, life cycle, the same source as the world; ADEME and RTE remain cited
First version of the entry
Value set for the series of articles on AI: ADEME, Base Carbone, 51.9 gCO2e/kWh

Charts and maps

A question about a figure?

An error, a source to add, a methodology question, a press request: write to us. Guillaume Pakula, Clément Reynaud, Sébastien Pierfederici and Alexandre Veilly will reply.

Write to us →

Projet Celsius, which runs this hub, also helps companies measure and reduce the footprint of their AI use.

Accounting for AI in your Bilan Carbone® ↗
Projet Celsius, environmental strategy consultancy

We support companies that account for AI in their Bilan Carbone®

Visiter Projet Celsius ↗