

Key figures
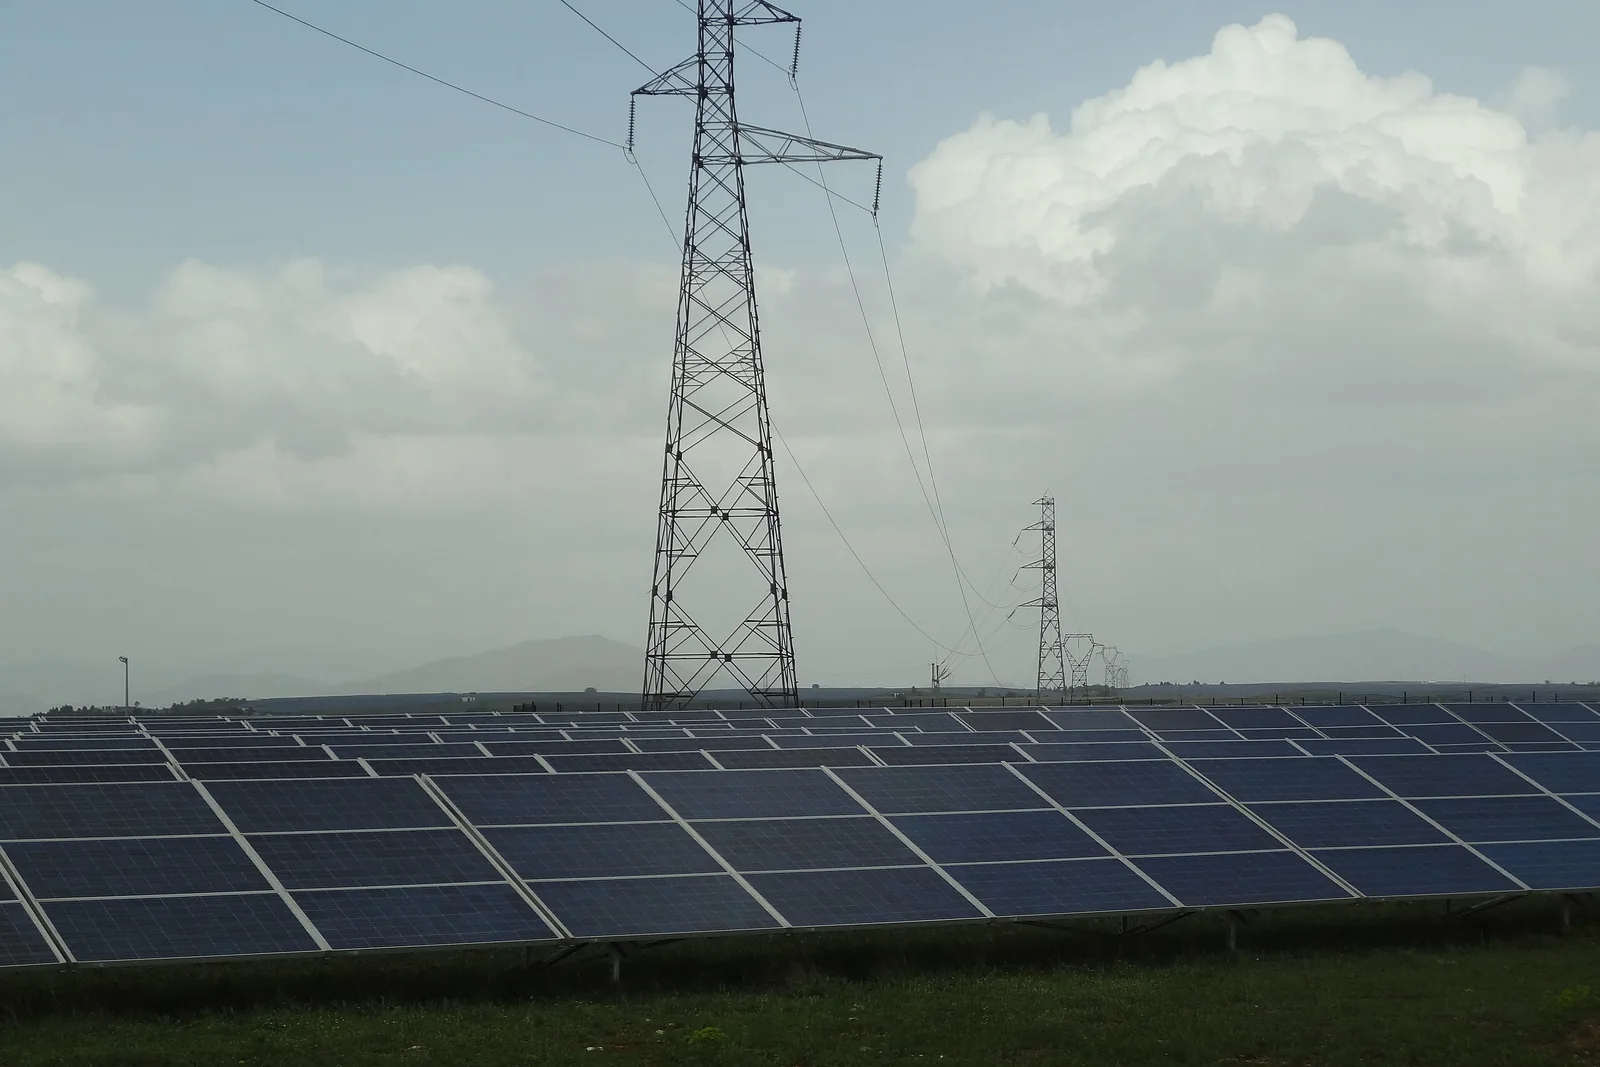

Key figureWorld · 2024Electricity consumed by data centres in 2024415TWhabout 1.5% of the electricity consumed worldwideAll uses, not AI aloneIEA, April 2025Key figureWorld · 2030Data centre electricity in 2030, baseline scenario945TWhAll uses, IEA scenarioIEA, April 2025Key figureWorld · 2025Electricity consumed by AI worldwide in 2025100 to 174TWh2 estimates, low and highSchneider Electric; GreenIT
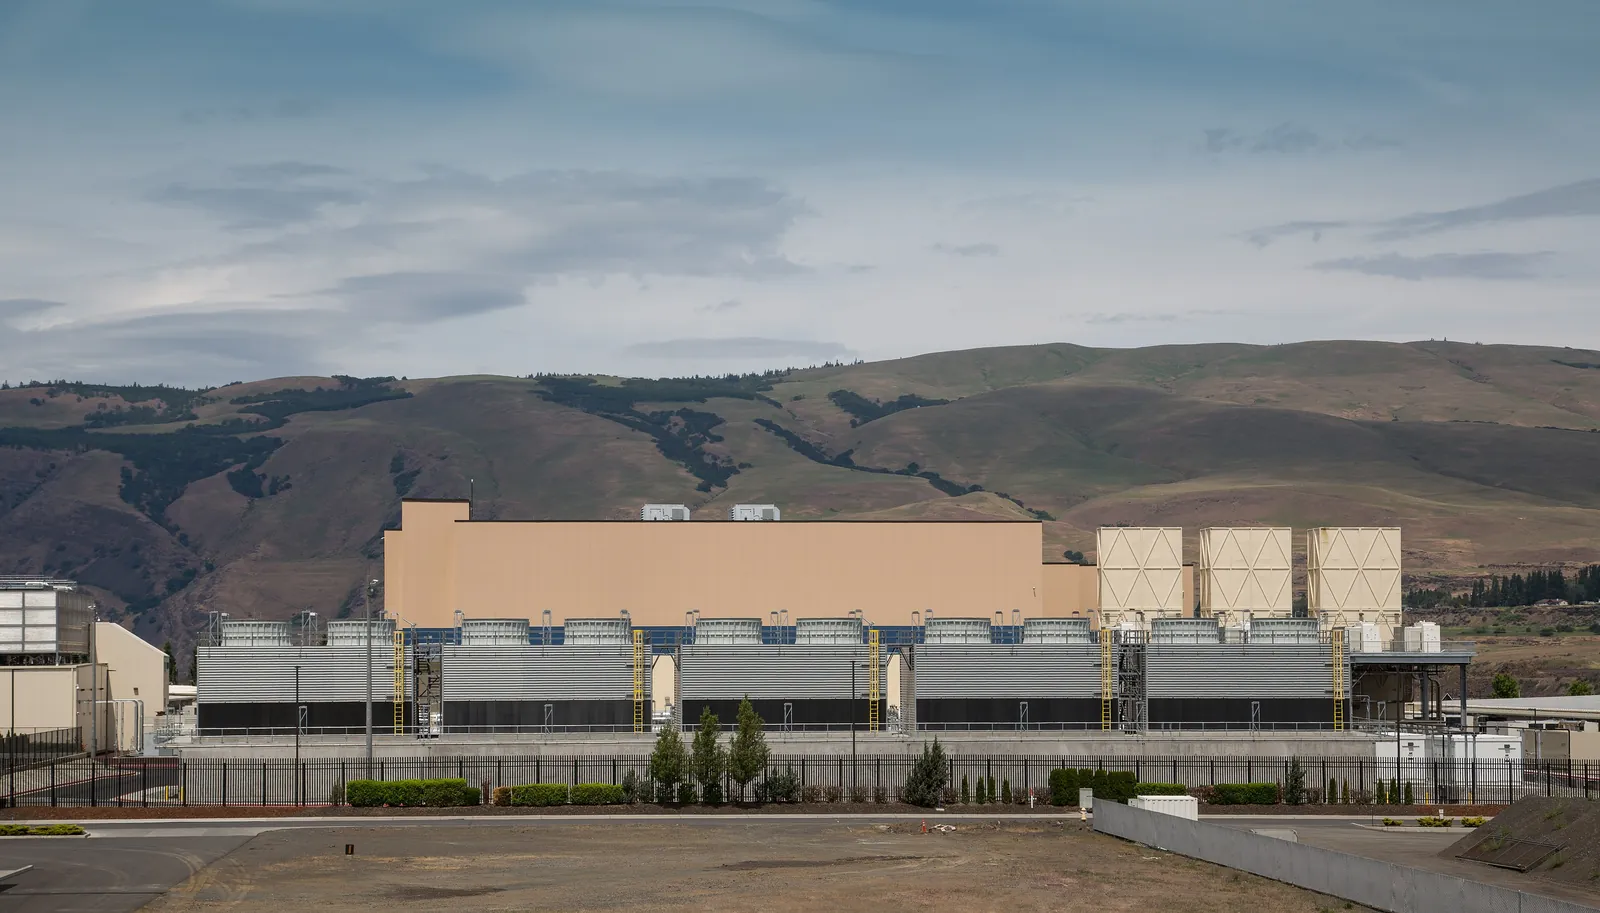

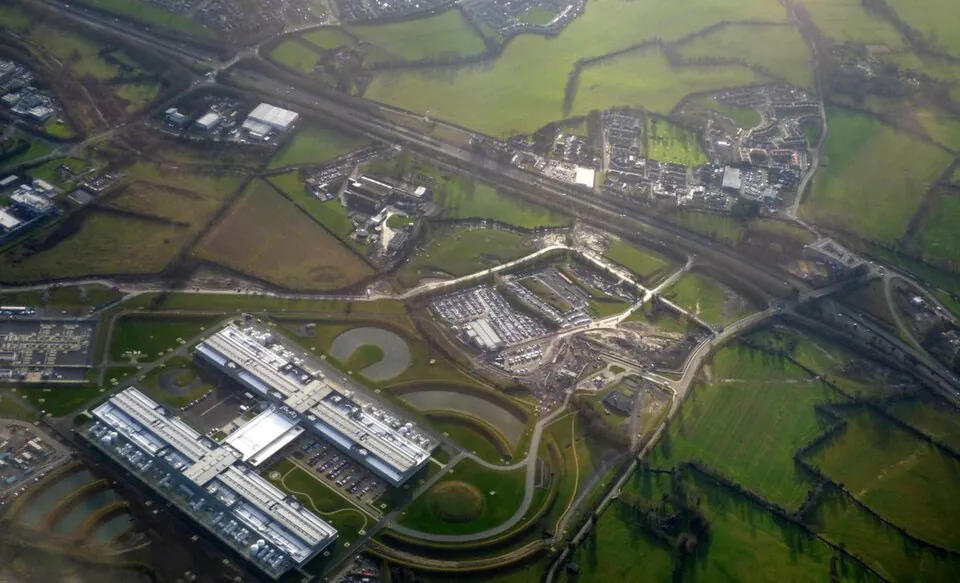

Key figureOne question · 2025Carbon footprint of one Le Chat response, life cycle1.14gCO2ea page of text, full life cyclethe same answer: 45 mL of waterMistral Large 2, with Carbone 4 and ADEMEMistral AI, July 2025Key figureWorld · 2025Carbon intensity of world electricity458gCO2e/kWhLife cycle, AI Impact DatabaseEmber, 2026Key figureFrance · 2025Carbon intensity of electricity in France41.4gCO2e/kWhLife cycle, electricity generatedEmber, 2026Key figureFrance · 2022The digital sector's share of France's carbon footprint4.4%434 kgCO2e per person in France per year2022 data, 29.5 MtCO2eADEME, January 2025


Key figureOne question · 2025Electricity used by a text query to Gemini0.24Wh0.14 Wh the AI chips0.10 Wh the rest of the centreprocessors, memory, standby machines, coolingMedian of text queriesGoogle, August 2025Key figureOne question · 2025Electricity used by a written question to an AI0.3Wh0.24 Wh, Google0.34 Wh, OpenAIthe range published by providersA typical questionEpoch AI, February 2025Key figureOne question · 2024Electricity used by an AI-generated image2.9Whabout 15% of a phone charge (19 Wh)Average of open modelsLuccioni et al., 2024; EPAKey figureOne question · 2025Electricity used by a generated 5-second video90Wh300 written questions, or 31 imagesWAN 2.1, open generatorDelavande, Pierrard and Luccioni, 2025
Also in Charts and maps
Across the hub
 AI Impact DatabaseAll the figures, their methodology and their sources.
 AI Ranking10 assistants rated out of 100: performance, ethics and environment.


 AnalysesThe signed pieces: analyses, viewpoints, "Where does this figure come from?".
 Charts and mapsYou are hereThe reference visuals, with their data and sources.
 ToolsOpen calculations, your assumptions on the left, the result on the right.






A question about a figure?
An error, a source to add, a methodology question, a press request: write to us. Guillaume Pakula, Clément Reynaud, Sébastien Pierfederici and Alexandre Veilly will reply.
Write to us →
Projet Celsius, which runs this hub, also helps companies measure and reduce the footprint of their AI use.
Accounting for AI in your Bilan Carbone® ↗





