Key figureWaterUpdated on 11 November 2026

560billion litres

Water consumed by the world's data centres

World · per year, in 2023 · water consumed, direct and indirect · IEA

These are all data centres, not AI alone; about 1,200 billion litres in 2030 in the IEA base case.
See the source
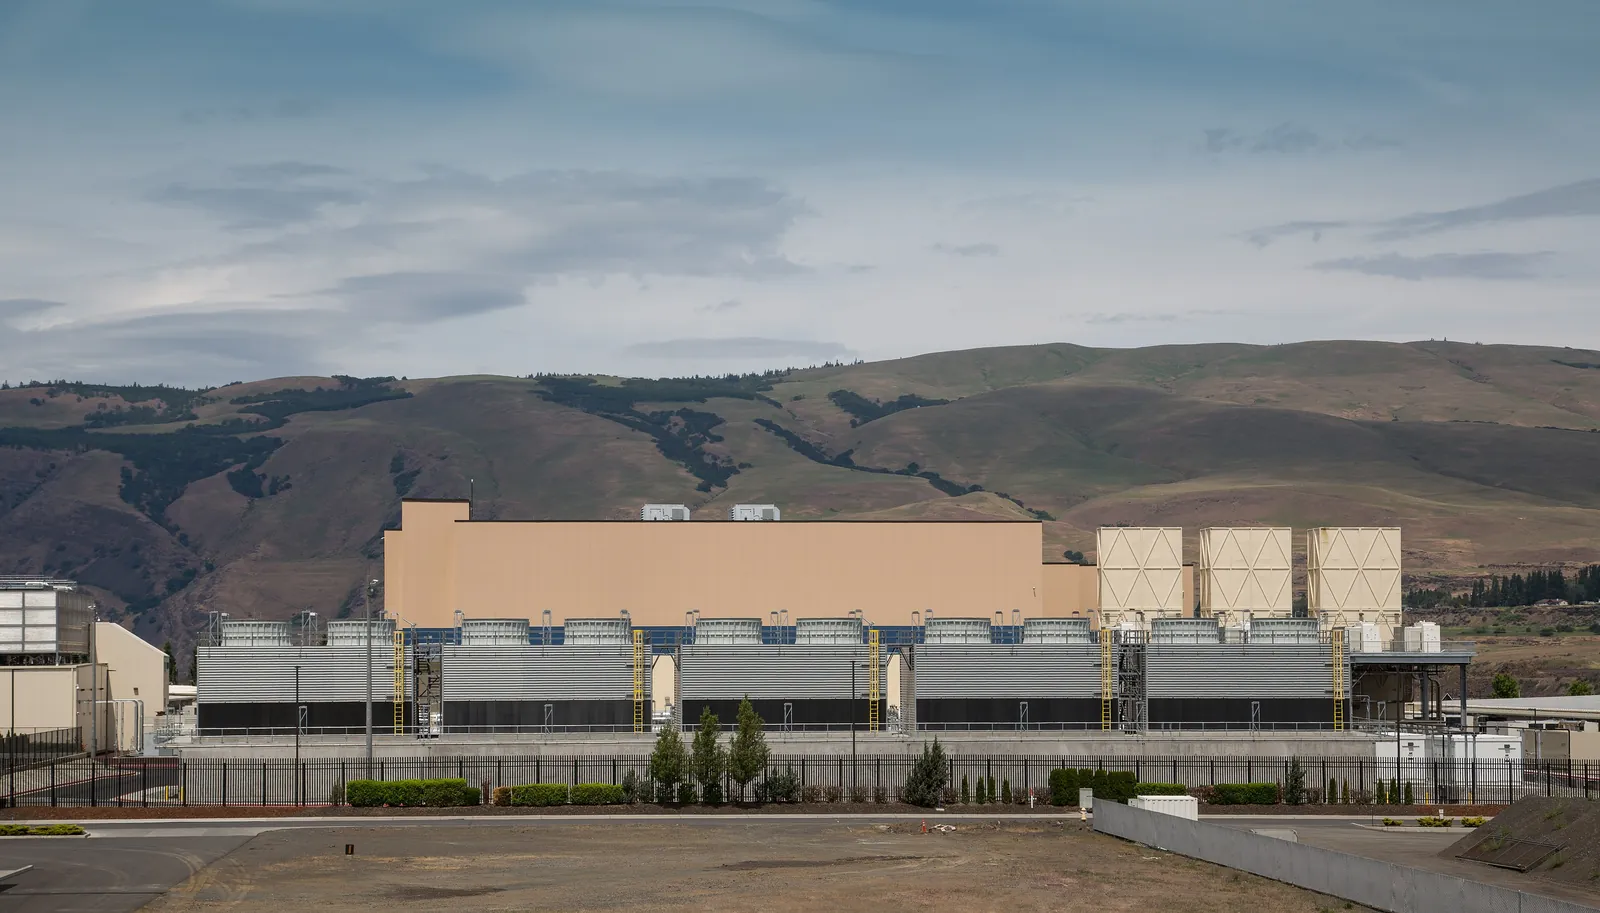
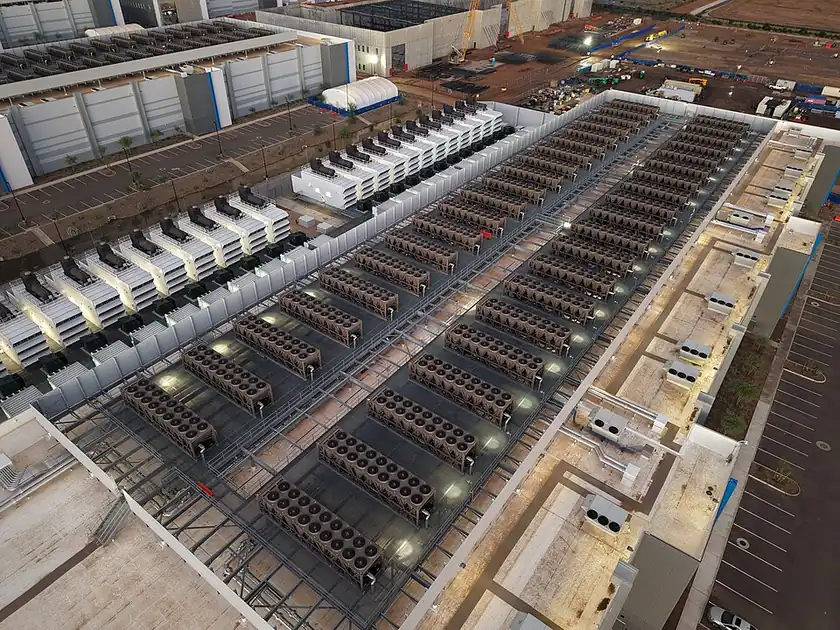
Chillers lined up on the roof of a data centre, in Mesa, Arizona
The chillers on the roof of a data centre, in Mesa, Arizona. Photo Rsparks3, Wikimedia Commons, CC0

Definition and scope

Water consumed in 2023 by data centres worldwide, on site for cooling, and indirectly through the production of their electricity and the manufacturing of chips, according to the IEA.

What is included

  • Water evaporated on site
  • Water consumed by the production of the centres' electricity
  • Water consumed by chip manufacturing

What is excluded

  • Water withdrawn then returned to the environment

How the value is obtained

IEA estimate based on the electricity consumption of the centres, their cooling technologies and the water of the power plants that supply them.

Limits and uncertainties

  • A global average: water stress plays out basin by basin.
  • The share of AI is not isolated.

The order of magnitude

All figures

560 billion litres on a water scale, with another reference figure and 3 values from the linked chart, brought to the same unit. Each tick multiplies by 10.

1 mL1 L1 m³1,000 m³1 million m³1 billion m³560 billion litresData centres worldwide0.26 mLQuestion to Gemini0.32 mLOpenAI, ChatGPT10 to 50 mLUC Riverside, GPT-345 mLMistral AI, Le Chat
1 mL1 L1 m³1,000 m³1 million m³1 billion m³560 billion litresData centres worldwide10 to 50 mLUC Riverside, GPT-345 mLMistral AI, Le Chat0.32 mLOpenAI, ChatGPT0.26 mLQuestion to Gemini
This figureAnother reference figure (link to its entry)A value from the chart "The water of a question, from 0.26 to 50 mL depending on scope"Logarithmic scale

The water of a question, from 0.26 to 50 mL depending on scope

Water attributed to a written question to an AI, in millilitres (logarithmic scale)

2023 to 2025

A factor of about 190 separates the lowest, 0.26 mL (Google), from the highest, 50 mL (UC Riverside): it stems from scope and task, not from a calculation error.

0.11× 1010× 10100 mL× 10ScalelogarithmicmL (logarithmic scale)Google, Geminion-site cooling, measured0.26 mLOpenAI, ChatGPTdeclaration, no methodology0.32 mLUC Riverside, GPT-3cooling and electricity10 to 50 mLMistral AI, Le Chatfull life cycle45 mLa factor of 170with Google, by scope
Source: Google; OpenAI; UC Riverside; Mistral AI · projetcelsius.com/en/ai · CC BY 4.0AI Impactby Projet Celsius

Update history

The hub changelog
Value dated 2023 and scope specified: water consumption, chip manufacturing included; 2030 in the IEA base case
First version of the entry

Charts and maps

ChartWaterWater for one question, from 0.26 to 50 mL depending on scope× 170from Google, 0.26 mL, to Mistral AI, 45 mLChartWaterMicrosoft's water use, 2020-202550%of withdrawals in financial year 2025 in water-stressed areasMapWaterWater stress, country by country17.6%world average in 2023Key figureWaterWater for one question to GeminiMedian · written question · Google measurement, August 2025

A question about a figure?

An error, a source to add, a methodology question, a press request: write to us. Guillaume Pakula, Clément Reynaud, Sébastien Pierfederici and Alexandre Veilly will reply.

Write to us →

Projet Celsius, which runs this hub, also helps companies measure and reduce the footprint of their AI use.

Accounting for AI in your Bilan Carbone® ↗
Projet Celsius, environmental strategy consultancy

We support companies that account for AI in their Bilan Carbone®

Visiter Projet Celsius ↗