

Microsoft's water use, 2020-2025
Water withdrawn and water consumed, in million m³ per fiscal year
Microsoft's water use, 2020-2025
The analysis
- Water consumed, which does not return to the environment (mostly evaporated), doubled between 2020 and 2025.
- 50% of withdrawals in fiscal year 2025 take place in water-stressed areas, according to the company.
- Microsoft states that in 2025 it replenished more water than it withdrew (14 million m³): this is an offset, not a reduction in withdrawal.
The figures
- Withdrawn: 6.8 million m³ in 2020, 13.3 million m³ in 2025.
- Consumed: 4 million m³ in 2020, 8.2 million m³ in 2025.
Assumptions
- The whole company, data centres included.
- The series were recalculated in the 2026 edition; do not mix them with those of earlier reports.
- The years 2021 to 2023 are not reproduced here.
- The water of electricity generation and hardware manufacturing is not counted.
More on water
The whole Water topic →Charts and maps
Chart WaterWater for one question, from 0.26 to 50 mL depending on scope× 170from Google, 0.26 mL, to Mistral AI, 45 mLMapWaterWater stress, country by country17.6%world average in 2023Key figureWaterWater for one question to GeminiMedian · written question · Google measurement, August 2025Key figureWaterWater consumed by the world's data centresWorld · per year, in 2023 · water consumed, direct and indirect · IEA
WaterWater for one question, from 0.26 to 50 mL depending on scope× 170from Google, 0.26 mL, to Mistral AI, 45 mLMapWaterWater stress, country by country17.6%world average in 2023Key figureWaterWater for one question to GeminiMedian · written question · Google measurement, August 2025Key figure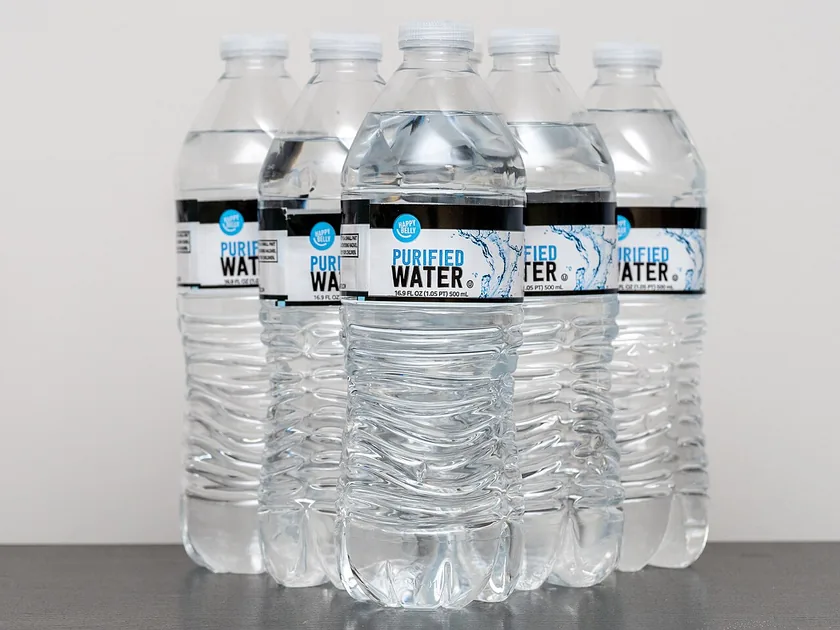 WaterWater consumed by the world's data centresWorld · per year, in 2023 · water consumed, direct and indirect · IEA
Analyses
On the Projet Celsius blog ↗
Across the hub
 AI Impact DatabaseAll the figures, their methodology and their sources.
 AI Ranking10 assistants rated out of 100: performance, ethics and environment.


 AnalysesThe signed pieces: analyses, viewpoints, "Where does this figure come from?".
 Charts and mapsYou are hereThe reference visuals, with their data and sources.
 ToolsOpen calculations, your assumptions on the left, the result on the right.






A question about a figure?
An error, a source to add, a methodology question, a press request: write to us. Guillaume Pakula, Clément Reynaud, Sébastien Pierfederici and Alexandre Veilly will reply.
Write to us →
Projet Celsius, which runs this hub, also helps companies measure and reduce the footprint of their AI use.
Accounting for AI in your Bilan Carbone® ↗





