MapWater

Water stress, country by country

Freshwater withdrawals as a share of available resources, in %, 2023.

Why this map matters for AI

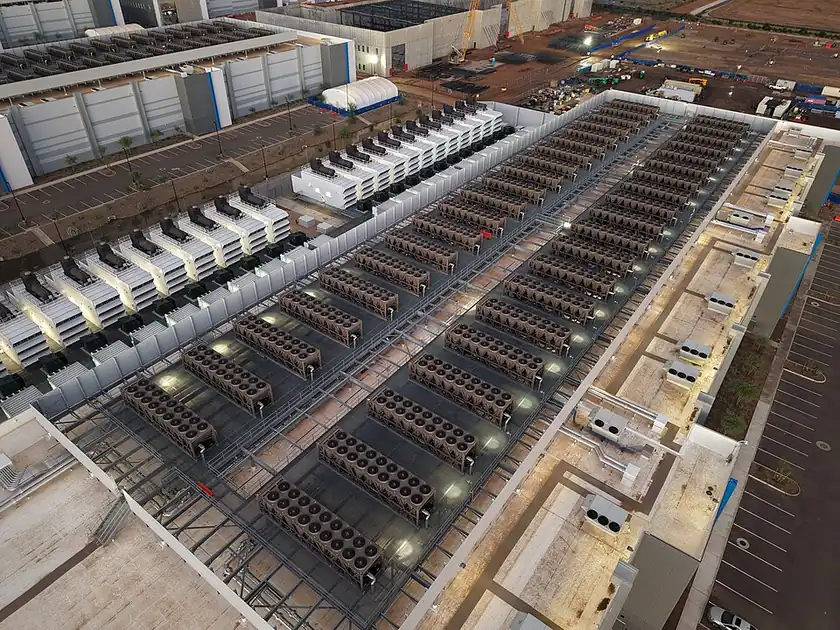
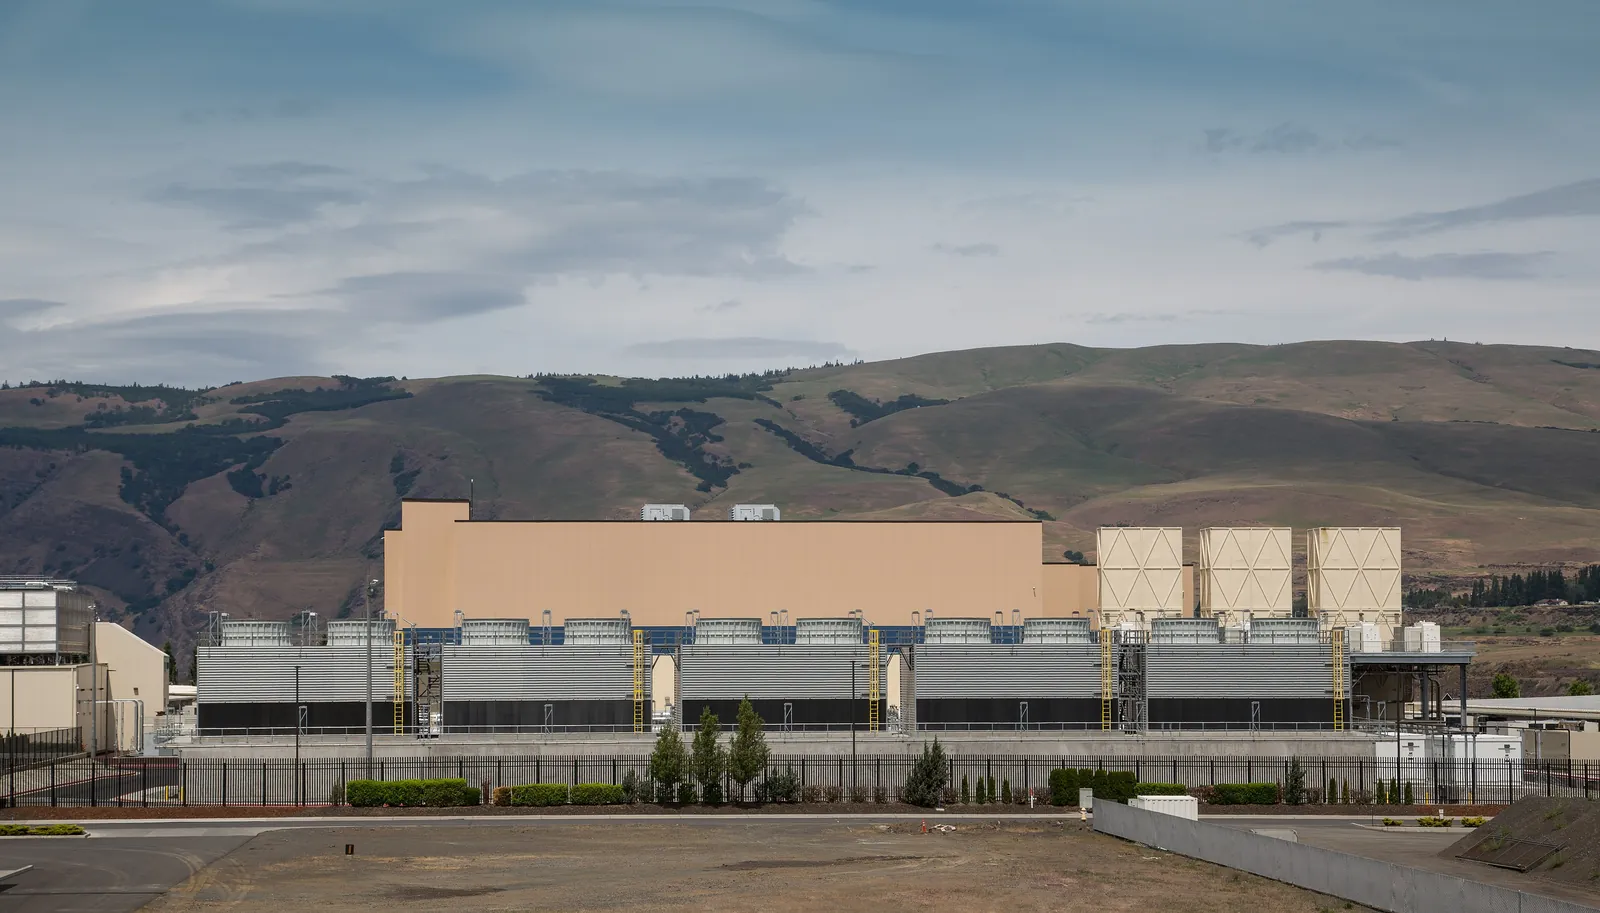
The volume of water of a data centre matters less than its location. Where withdrawals approach or exceed resources, every m³ evaporated by cooling weighs on agriculture and drinking water.

Published on 20 October 2026 · updated on 20 October 2026

France : 21 % (2023)

Fiji: 0.6%Tanzania: 13%Western Sahara: no dataCanada: 3.7%United States: 25%Kazakhstan: 34%Uzbekistan: 123%Papua New Guinea: 0.1%Indonesia: 30%Argentina: 11%Chile: 9%DR Congo: 0.2%Somalia: 25%Kenya: 11%Sudan: 119%Chad: 4.3%Haiti: 13%Dominican Republic: 40%Russia: 4.2%Bahamas: no dataFalkland Islands: no dataNorway: 2%Greenland: no dataFrench Southern Territories: no dataTimor-Leste: 28%South Africa: 68%Lesotho: 2.6%Mexico: 45%Uruguay: 12%Brazil: 1.4%Bolivia: 0.2%Peru: 3.6%Colombia: 3.7%Panama: 0.9%Costa Rica: 5.9%Nicaragua: 2.2%Honduras: 4.6%El Salvador: 13%Guatemala: 5.7%Belize: 0.1%Venezuela: 7.5%Guyana: 0.3%Suriname: 4%France: 21%Ecuador: 1.1%Puerto Rico: 20%Jamaica: 12%Cuba: 22%Zimbabwe: 46%Botswana: 2.3%Namibia: 0.3%Senegal: 16%Mali: 43%Mauritania: 13%Benin: 1%Niger: 11%Nigeria: 30%Cameroon: 1.6%Togo: 3.4%Ghana: 0.5%Ivory Coast: 5.1%Guinea: 1.4%Guinea-Bissau: 1.5%Liberia: 0.3%Sierra Leone: 0.5%Burkina Faso: 1.3%Central African Republic: 0.3%Republic of the Congo: 0%Gabon: 0.5%Equatorial Guinea: 0.2%Zambia: 8.6%Malawi: 4.1%Mozambique: 1.8%Kingdom of Eswatini: 78%Angola: 1.9%Burundi: 10%Israel: 120%Lebanon: 59%Madagascar: 25%Palestine: 45%Gambia: 2.2%Tunisia: 97%Algeria: 145%Jordan: 105%United Arab Emirates: 1,437%Qatar: 431%Kuwait: 3,851%Iraq: 68%Oman: 117%Vanuatu: no dataCambodia: 1%Thailand: 22%Laos: 4.8%Myanmar: 5.8%Vietnam: 18%North Korea: 28%South Korea: 85%Mongolia: 5%India: 66%Bangladesh: 5.7%Bhutan: 1.4%Nepal: 8.3%Pakistan: 98%Afghanistan: 55%Tajikistan: 70%Kyrgyzstan: 50%Turkmenistan: 135%Iran: 80%Syria: 124%Armenia: 62%Sweden: 3.6%Belarus: 4.7%Ukraine: 7.3%Poland: 33%Austria: 8.7%Hungary: 7.6%Moldova: 12%Romania: 7.5%Lithuania: 2.2%Latvia: 1%Estonia: 8.6%Germany: 32%Bulgaria: 39%Greece: 18%Turkey: 48%Albania: 4.8%Croatia: 1.6%Switzerland: 6.5%Luxembourg: 4%Belgium: 53%Netherlands: 15%Portugal: 12%Spain: 43%Ireland: 9.4%New Caledonia: no dataSolomon Islands: no dataNew Zealand: 8.1%Australia: 4.2%Sri Lanka: 91%China: 42%Taiwan: no dataItaly: 30%Denmark: 27%United Kingdom: 14%Iceland: 0.4%Azerbaijan: 58%Georgia: 4.2%Philippines: 28%Malaysia: 3.4%Brunei Darussalam: 3.5%Slovenia: 6.4%Finland: 7.1%Slovakia: 2.4%Czechia: 20%Eritrea: 11%Japan: 35%Paraguay: 1.8%Yemen: 282%Saudi Arabia: 974%Northern Cyprus: no dataCyprus: 31%Morocco: 19%Egypt: 113%Libya: 817%Ethiopia: 32%Djibouti: 6.3%Somaliland: no dataUganda: 5.8%Rwanda: 6.6%Bosnia and Herzegovina: 2.1%North Macedonia: 66%Serbia: 5.8%Montenegro: no dataKosovo: no dataTrinidad and Tobago: 20%South Sudan: 4.2%
%less than 2525 to 5050 to 7575 to 100100 and aboveno data
Reference points, in %Kuwait, 1st3,851France21World, 202318Papua New Guinea, 162nd0.1
Source: FAO, SDG indicator 6.4.2 (level of water stress), via Our World in Data. Base map Natural Earth · projetcelsius.com/en/ai · CC BY 4.0AI Impactby Projet Celsius

The analysis

  • The volume of water of a data centre matters less than its location: where withdrawals approach resources, every m³ evaporated weighs on agriculture and drinking water.
  • Above 100 %, a country draws on non-renewable groundwater or desalinates seawater: this is the case for Saudi Arabia and Egypt.

The figures

  • The FAO distinguishes 5 levels: no stress below 25 %, low from 25 to 50%, medium from 50 to 75%, high from 75 to 100%, critical above that.
  • France is at 21 %, Spain at 43 %, India at 66 %, the world average at 17.6 %.

Assumptions

  • A national average: stress plays out basin by basin. The United States (25%) has regions under critical stress, such as Arizona.
  • The indicator counts withdrawals, not consumption: water returned to the environment is included.
  • All freshwater withdrawals of the country (agriculture, industry, domestic uses), as a share of renewable resources, after the needs of ecosystems.
  • 2023 data.

The map in detail

Countries, by map colour
  1. 107less than 25United States, France, world average
  2. 2425 to 50Spain
  3. 1050 to 75India
  4. 675 to 100
  5. 15100 and aboveSaudi Arabia, Egypt
Number of countries and territories in each class of the map, in % · FAO, 2023

All values

The 162 countries and territories of the map, from the highest value to the lowest, with their year.

Or choose a country on the map above.

Sources

Updated on 20 October 2026MethodologyAll sourcesLicence CC BY 4.0

A question about a figure?

An error, a source to add, a methodology question, a press request: write to us. Guillaume Pakula, Clément Reynaud, Sébastien Pierfederici and Alexandre Veilly will reply.


Write to us →

Projet Celsius, which runs this hub, also helps companies measure and reduce the footprint of their AI use.

Accounting for AI in your Bilan Carbone® ↗
Projet Celsius, environmental strategy consultancy

We support companies that account for AI in their Bilan Carbone®

Visiter Projet Celsius ↗