 Water13 November 2026
Does AI really use water, and how?
From the server to the cooling tower, and from the power plant to the chip factory




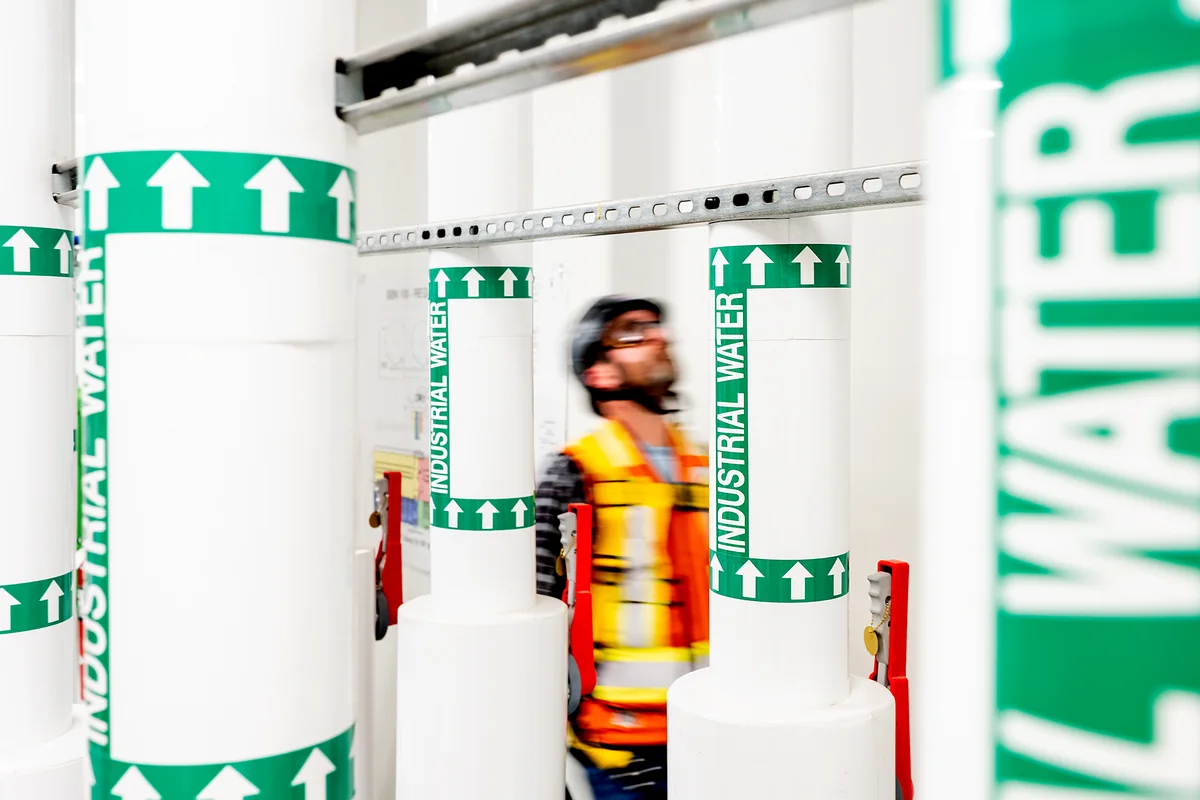
The industrial water pipes of a data centre in Project Rainier, built by AWS in Indiana. Photo Amazon (AWS).
Yes: AI uses water in 3 ways. Data centres evaporate it to remove heat from the servers, the power stations that supply them evaporate it to cool themselves, and chip factories use it to make the hardware. In the United States in 2023, the water embedded in the electricity of data centres was about 12 times that of their sites. Every water figure is read with its definition, withdrawn or consumed, and with the basin where the water is taken.
Contents
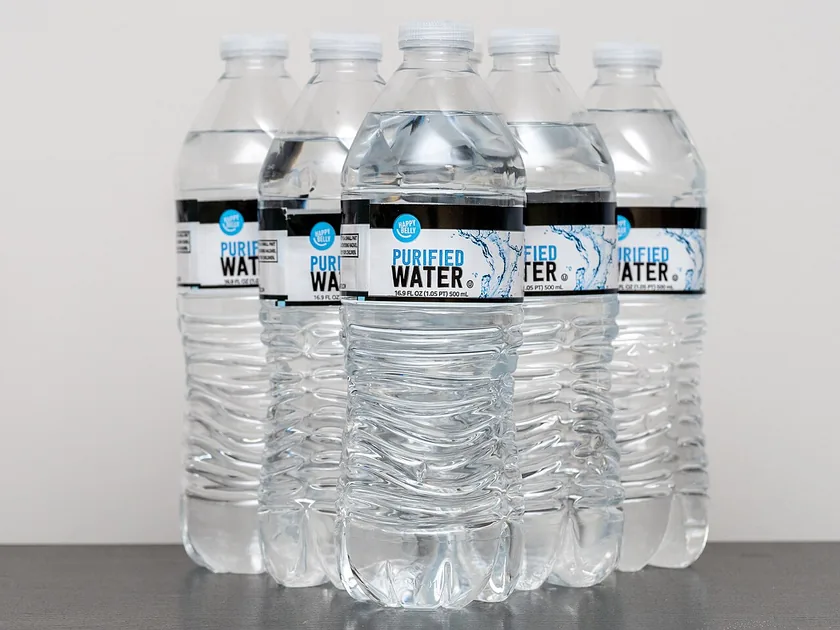
The question often comes back as a single figure: a bottle of water per e-mail, a few drops per question. Our note on the water bottle and the blog article on the water footprint of AI give these values: from 0.26 mL for a question to Gemini, site water only, to 45 mL for a Mistral AI response over its life cycle.
These figures do not say how the water is consumed, or why they differ so much. To understand this, you have to follow the water along 3 paths: that of the data centre, where it cools the servers; that of the power plant, which produces their electricity; that of the factory, which makes the chips. On each, you also have to distinguish water withdrawn, pumped and then partly returned, from water consumed, which does not return to the environment.

A server turns almost all of its electricity into heat
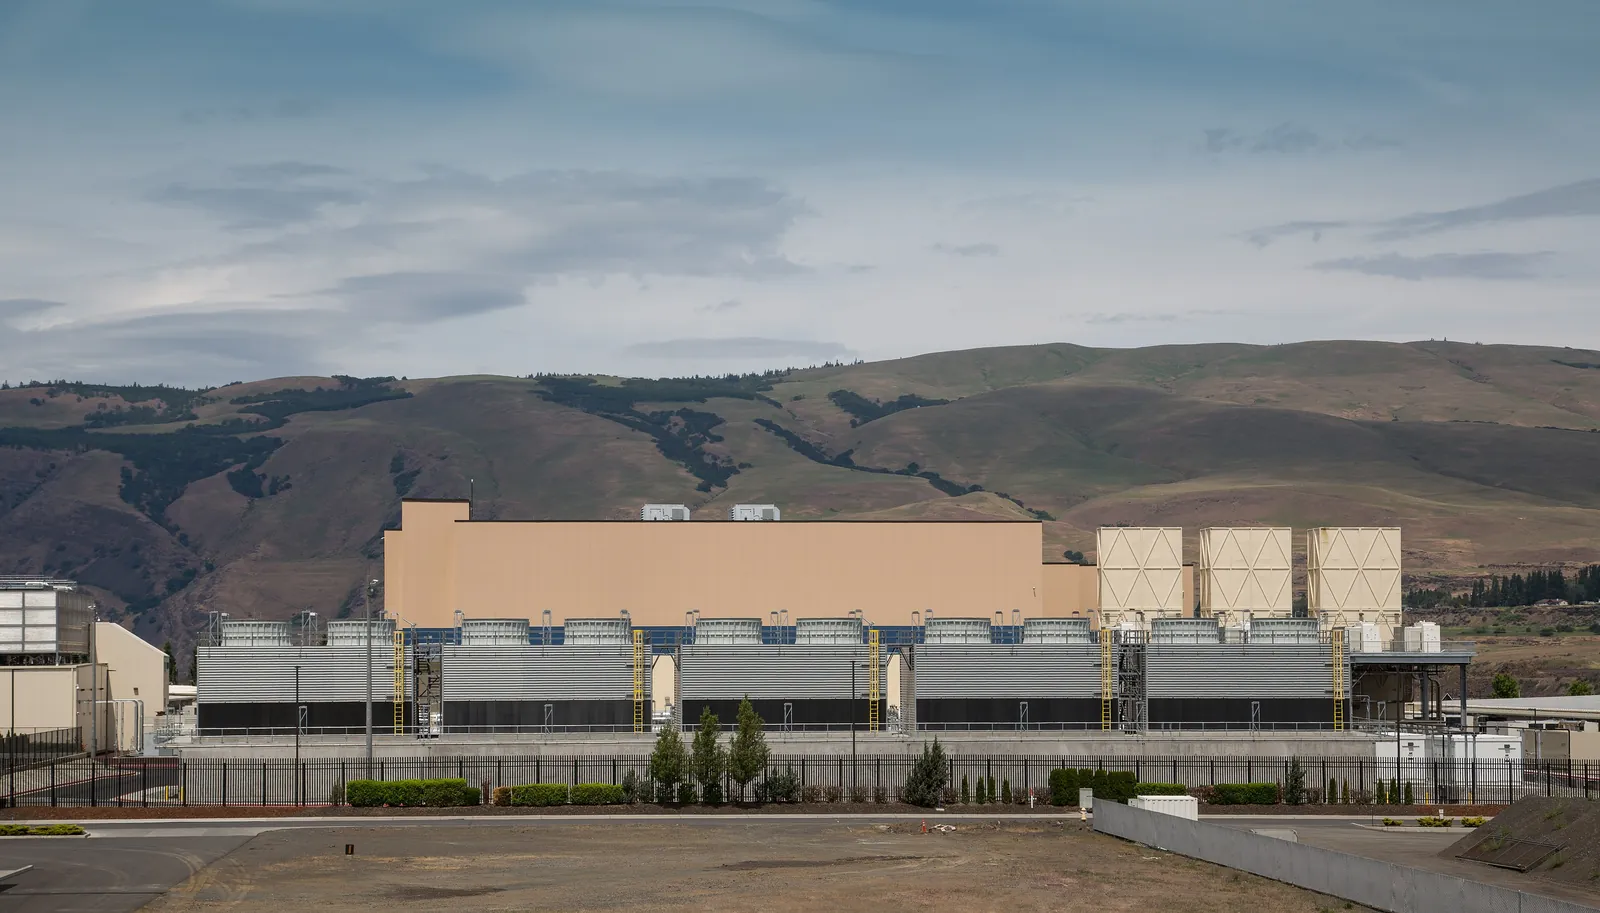
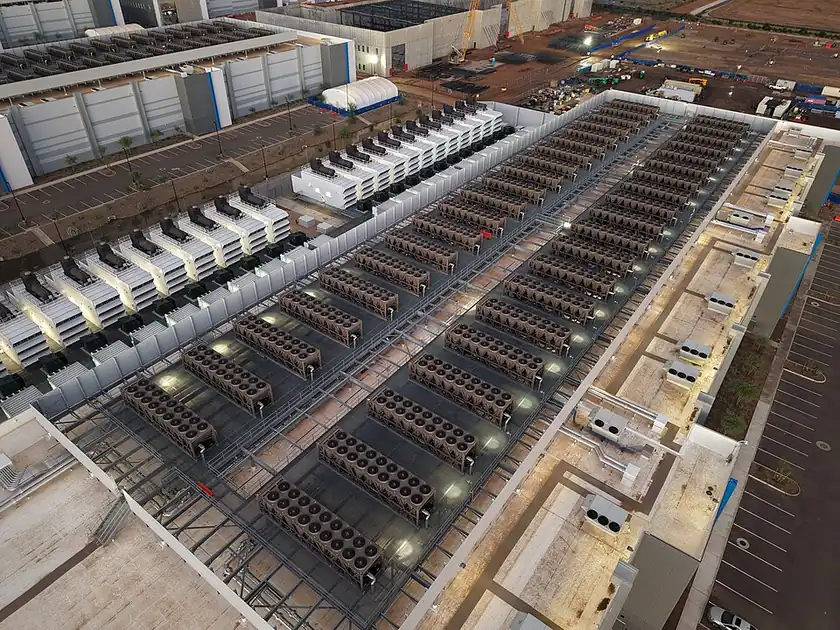
A chip that computes heats up: almost all the electricity a server receives comes out as heat, which has to be removed from the room. To reject it into the outdoor air, operators have 2 main families of systems. Some reject it by warming the air, with fans and heat exchangers, like a car radiator. Others reject it by evaporating water, in cooling towers or by misting the incoming air.
Evaporation is effective because it absorbs a lot of heat: about 2,300 kJ per litre of water evaporated. If all the heat from one kWh of electricity were removed this way, about 1.6 litre of waterwould have to be evaporated, according to our calculation. This is an order of magnitude. Actual values can exceed it: the heat of the cooling equipment adds to that of the servers, and misting also cools the outdoor air. The LBNL simulations thus give 2 to more than 3 litres per kWh for water-cooled chillers without an economiser. The Lawrence Berkeley National Laboratory (LBNL), the reference body in the United States, sums up the trade-off: air-cooled chillers use no water but more energy; evaporative systems are generally more energy efficient.
About 80% of the water withdrawn by a cooling tower evaporates
Water pumped from a network, a river or an aquifer. Part of it returns to the environment, often warmer or richer in minerals.
The share of the withdrawal that does not return to the environment, mainly because it has evaporated. It is this water that downstream users go without.
In a cooling tower, the water that evaporates leaves its minerals in the water that remains. To prevent scale, the operator regularly discharges part of it, the blowdown, and replaces it with fresh water. The blowdown returns to the sewers or the environment; the vapour does not. According to Shaolei Ren's team at the University of California, Riverside, about 80% of the water withdrawn evaporates when the water is of good quality. At Google, data centres consumed 10,523 million gallons out of 13,562 withdrawn in 2025, or 78%; Microsoft, across all its sites, 8,170 megalitres out of 13,266 in its fiscal year 2025, 62%.
The difference between the 2 concepts explains part of the large gaps between figures. The same team projects for AI in 2027, using US electricity factors, a withdrawal of 4.2 to 6.6 billion m³, but a consumption of 0.38 to 0.60 billion m³, 11 times less. The withdrawal is inflated by the water that power plants pump and then return to the river. A water figure can only be compared with a figure of the same type, withdrawn or consumed.
The water withdrawn by data centres is mostly drinking water
Many data centres connect to the drinking water network of their municipality. In 2025, of the 13,562 million gallons withdrawn by Google's data centres, 81 % were drinking water, 12% non-potable water and 7% recycled wastewater. Microsoft buys almost all its water from suppliers, 13,192 of its 13,266 megalitres, without publishing the share of drinking water in that total. In France, Arcep notes that the volume withdrawn by data centres is almost entirely drinking water.
| Site | Source of the water | What is published |
|---|---|---|
| Douglas County, Georgia (Google) | Recycled wastewater | 394 million gallons out of 441 withdrawn in 2025 |
| Eemshaven, Pays-Bas (Google) | Non-potable water | 529 million gallons out of 532 withdrawn in 2025 |
| Hamina, Finlande (Google) | Seawater from the Gulf of Finland | Not counted in Google's water figures |
| 24 AWS sites | Recycled water | Number of sites in 2024; target to quadruple it by 2030 |
Examples published by operators. Google's volumes are in millions of gallons (1 gallon = 3.785 litres).
Operators who want to spare drinking water have 2 options: another source, recycled wastewater, industrial water or seawater, and better reuse of water in the tower. Seawater cools without withdrawing fresh water, but it is only possible on the coast; wastewater requires a nearby treatment plant and an agreement with it.
Operators publish between 0.12 and 1.15 litre per kWh, withdrawn or consumed
The water efficiency of a site is measured in litres per kWh consumed by the servers (WUE, for "water usage effectiveness"). Operators do not define it in the same way: Google and the LBNL report water consumed, Microsoft and AWS water withdrawn, part of which returns to the environment. The published values stay below the order of magnitude of 1.6 litre, because large sites use evaporation for only part of the year and cool the rest of the time with outdoor air.
| Operator or group | Water per kWh of servers | Year |
|---|---|---|
| Order of magnitude, all server heat evaporated | About 1.6 L | Our calculation |
| Large data centre in Arizona, in summer | About 9 L | Cited by Ren et al., 2025 |
| Google, data centres serving language models (consumption) | 1.15 L | 2024 |
| Average of US data centres (consumption) | A little over 0.36 L | 2023, LBNL |
| Microsoft (withdrawal) | 0.30 L, against 0.49 in 2021 | Fiscal year 2024 |
| AWS (withdrawal) | 0.12 L, against 0.15 in 2024 | 2025 |
Site water only. The ratios cannot be compared term for term: consumption at Google and in the LBNL report, withdrawal at Microsoft and AWS.
The annual average hides 2 effects. In summer, when evaporation runs the most, is also the season when rivers and aquifers are at their lowest. And the US average is rising: the LBNL expects it to reach between 0.45 and 0.48 litre per kWh after 2023, with the growing share of very large data centres and liquid cooling of AI servers.
In the United States and France, the water behind the electricity exceeds that of the sites
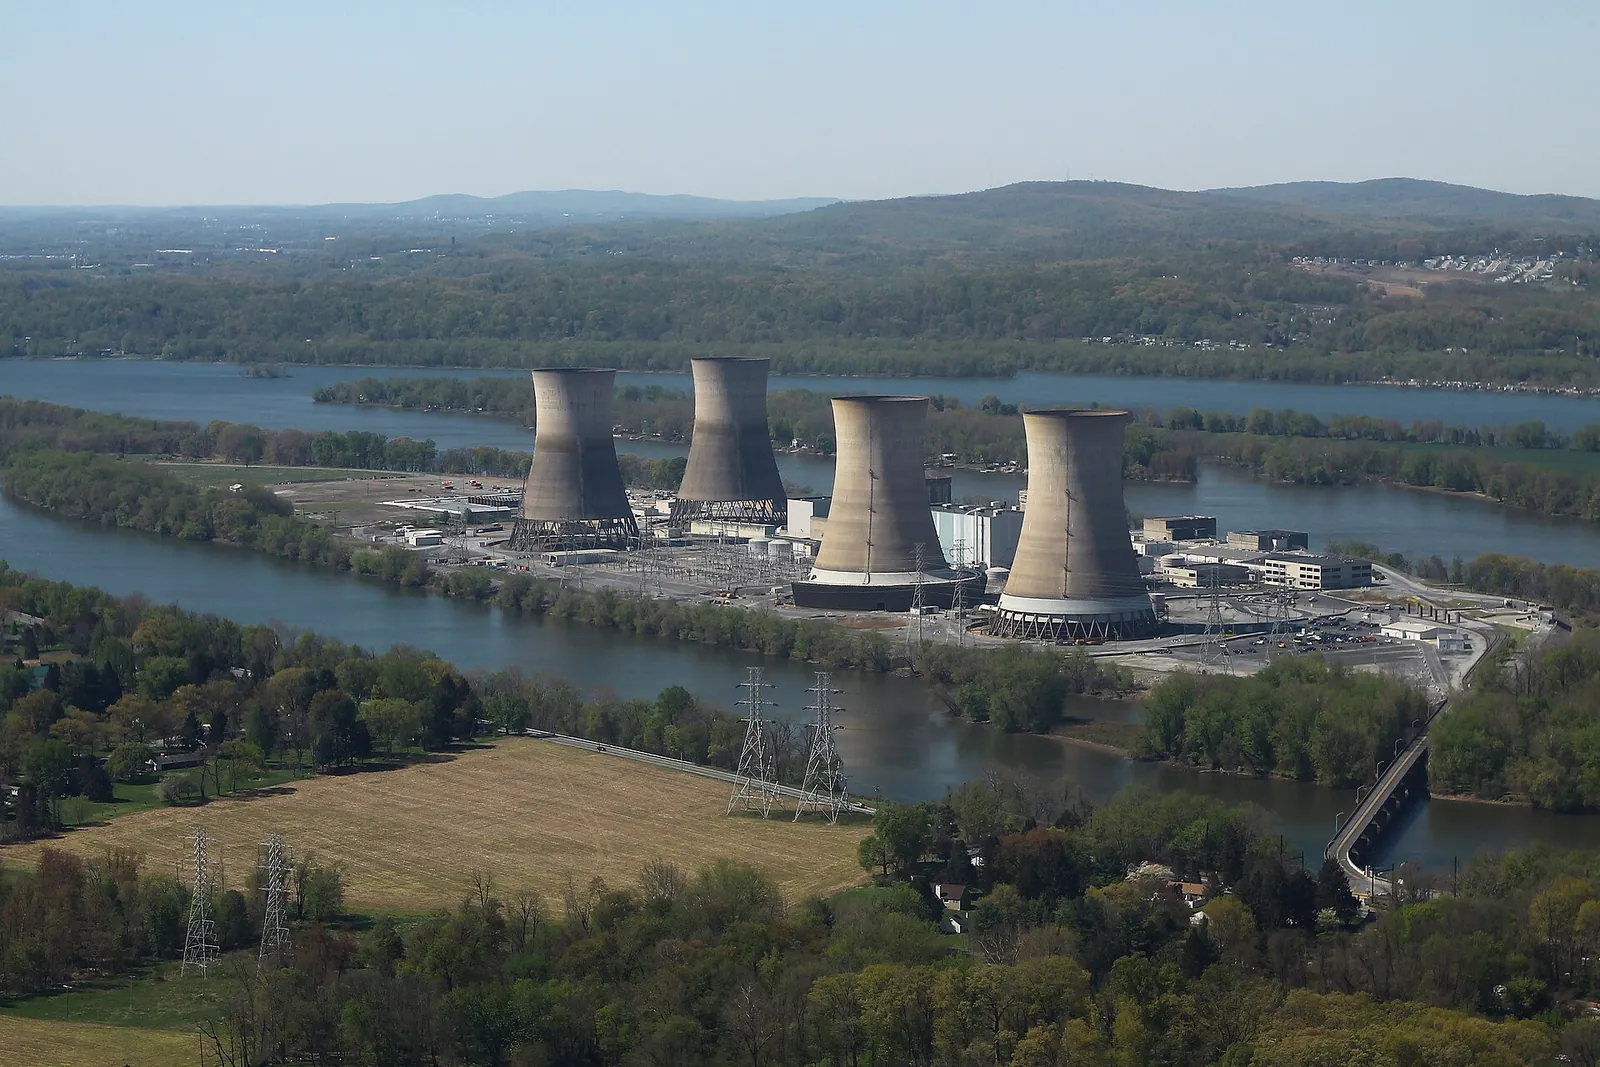
Thermal power plants, whether nuclear, coal or gas, are also cooled with water. They withdraw a lot of it and evaporate part of it. The LBNL estimates that in 2023, producing the electricity of US data centres consumed about 800 billion litres of water, 4.52 litres per kWh, against 66 billion on the sites themselves: about 12 times more. This calculation counts the water evaporated from hydroelectric dam reservoirs, a contested convention. A study from 2021, on US data from 2018, finds a lower ratio: site water there is about a quarter of the total. In France, Arcep also estimates that the water behind the electricity of data centres far exceeds their direct withdrawal, 575,000 m³ in 2024. Elsewhere, the ratio depends on the electricity mix and on how hydroelectricity is counted.
| Electricity generation | Water consumed per kWh | Water withdrawn per kWh |
|---|---|---|
| Nuclear, closed circuit with towers (France) | 2.4 L | 11 L |
| Nuclear, open circuit on a river (France) | 1.9 L | 233 L |
| Gas, combined cycle with tower (United States) | About 0.8 L | - |
| Photovoltaic (United States) | About 0.004 L | - |
| Wind (United States) | 0 | - |
| Hydroelectricity, reservoir evaporation (United States) | About 17 L, from 5 to 68 depending on the allocation | - |
Averages by technology: France Stratégie (2024) for French nuclear, Macknick et al. (2012) for US technologies, converted from gallons per MWh. For open circuit, the official statistic counts zero consumption; 1.9 L is France Stratégie's estimate.
The water of a data centre therefore also depends on its electricity. A site powered by wind and photovoltaic has almost no indirect water; a site powered by thermal plants with towers has several litres per kWh. In France, cooling nuclear power plants consumes about 0.5 billion m³ per year, 12% of the water consumed in the country on average from 2010 to 2019, against 58% for agriculture, according to the SDES estimate. The same reasoning applies to carbon: our map of electricity by country shows how much the country of the servers changes the footprint.
Without water, cooling uses more electricity
Since August 2024, Microsoft has been designing its new data centres with liquid cooling as close as possible to the chips, in a closed circuit: the water, filled once at construction, circulates between the servers and chillers without evaporating. Microsoft estimates that each data centre will thus avoid more than 125 million litres of water per year, a figure calculated with its average withdrawal WUE, 0.30 litre per kWh. Microsoft also writes that replacing evaporation with mechanical cooling will increase the electricity consumed by its sites for the same computing power.
This additional electricity itself has indirect water, and a carbon cost, which depend on the grid. The choice between water and electricity is therefore made site by site: where water is scarce and electricity is low-carbon, cooling without water has the advantage; elsewhere, the answer depends on the 2 footprints. Our analysis of river basins shows that several contested projects chose air cooling.
Chip manufacturing requires ultrapure water
Semiconductor factories use ultrapure water to rinse silicon wafers, and water to cool themselves. In Singapore, the average water recycling rate reaches 45% in wafer factories and 23% in semiconductor factories, cited by Shaolei Ren's team.
Few analyses attribute this water to a use of AI. Mistral AI's life cycle assessment is one: its 45 mL per response includes the water from manufacturing the servers, from electricity and from cooling, without the breakdown being published. The gap of about 170 with Google's 0.26 mL comes from these scopes, detailed in our analysis of the gaps ; Mistral AI does not publish the share of each route.
Our reading
For us, AI consumes water through routes that published figures separate poorly: the site, the electricity, the manufacturing. At the scale of one question, water is counted in drops or spoonfuls depending on the scope; what it does to a region is judged basin by basin, as shown by our analysis of river basins.
A water figure for AI is read with 3 questions: is the water withdrawn or consumed? Does it count the site alone, the electricity, the manufacturing? And in which basin is it taken? Operators publish the first 2 answers unevenly, and the 3rd site by site only at Google and Microsoft, among those we have read.
The order of magnitude of 1.6 litre per kWh is a Projet Celsius calculation based on the heat of evaporation of water. The LBNL report was read from a copy, as the original refuses automated reading. Operators' water-per-kWh ratios are not all defined in the same way (withdrawal or consumption). Microsoft's volumes cover all its sites, offices included. Google's 2026 report was read from a copy. The LBNL's US total for 2023, about 866 billion litres, exceeds the IEA's global estimate for the same year, about 560 billion litres: the 2 methods do not use the same water factors for electricity, and the LBNL counts evaporation from hydroelectric reservoirs. The 2 figures cannot be compared.
Sources
15 documents
- Handbook of Industrial Water Treatment, chapter 31, Open Recirculating Cooling Systemsentry 314
- Lawrence Berkeley National Laboratory, 2024 United States Data Center Energy Usage Report2024entry 12
- France Stratégie, Prélèvements et consommations d'eau : quels enjeux et usages ?, note d'analyse n° 1362024entry 315
- Li, Yang, Islam and Ren, Making AI Less "Thirsty"2023entry 31
- Google, 2026 Environmental Report2026entry 13
- Microsoft, 2026 Environmental Sustainability Report, Data Fact Sheet2026entry 15
- Arcep, enquête annuelle Pour un numérique soutenable, édition 20262026entry 311
- Amazon, 2024 Sustainability Report, AWS Summary2025entry 316
- Microsoft, Sustainable by design: Next-generation datacenters consume zero water for cooling2024entry 317
- Macknick, Newmark, Heath and Hallett, Operational water consumption and withdrawal factors for electricity generating technologies, Environmental Research Letters2012entry 318
- AFP, L'usage de l'eau douce en chiffres : qui prélève et qui consomme quoi en France ?, March 2023, republished by Connaissance des Énergies2023entry 319
- Mistral AI, with Carbone 4 and ADEME, Our contribution to a global environmental standard for AI2025entry 17
- Elsworth et al. (Google), Measuring the environmental impact of delivering AI at Google scale2025entry 14
- Amazon, 2025 Sustainability Report2026entry 320
- Siddik, Shehabi and Marston, The environmental footprint of data centers in the United States, Environmental Research Letters2021entry 307
Every figure was read in its source; the hub's methodology is described in Methodology and sources.
Impact de l'IA, Projet Celsius, "L'IA consomme-t-elle vraiment de l'eau, et comment ?", 13 November 2026. https://projetcelsius.com/en/ai/analyses/does-ai-really-use-water/