

 Uses13 November 2026
Which tasks make up the footprint of AI, by occupation?
18 occupations, their tasks and server electricity over a year




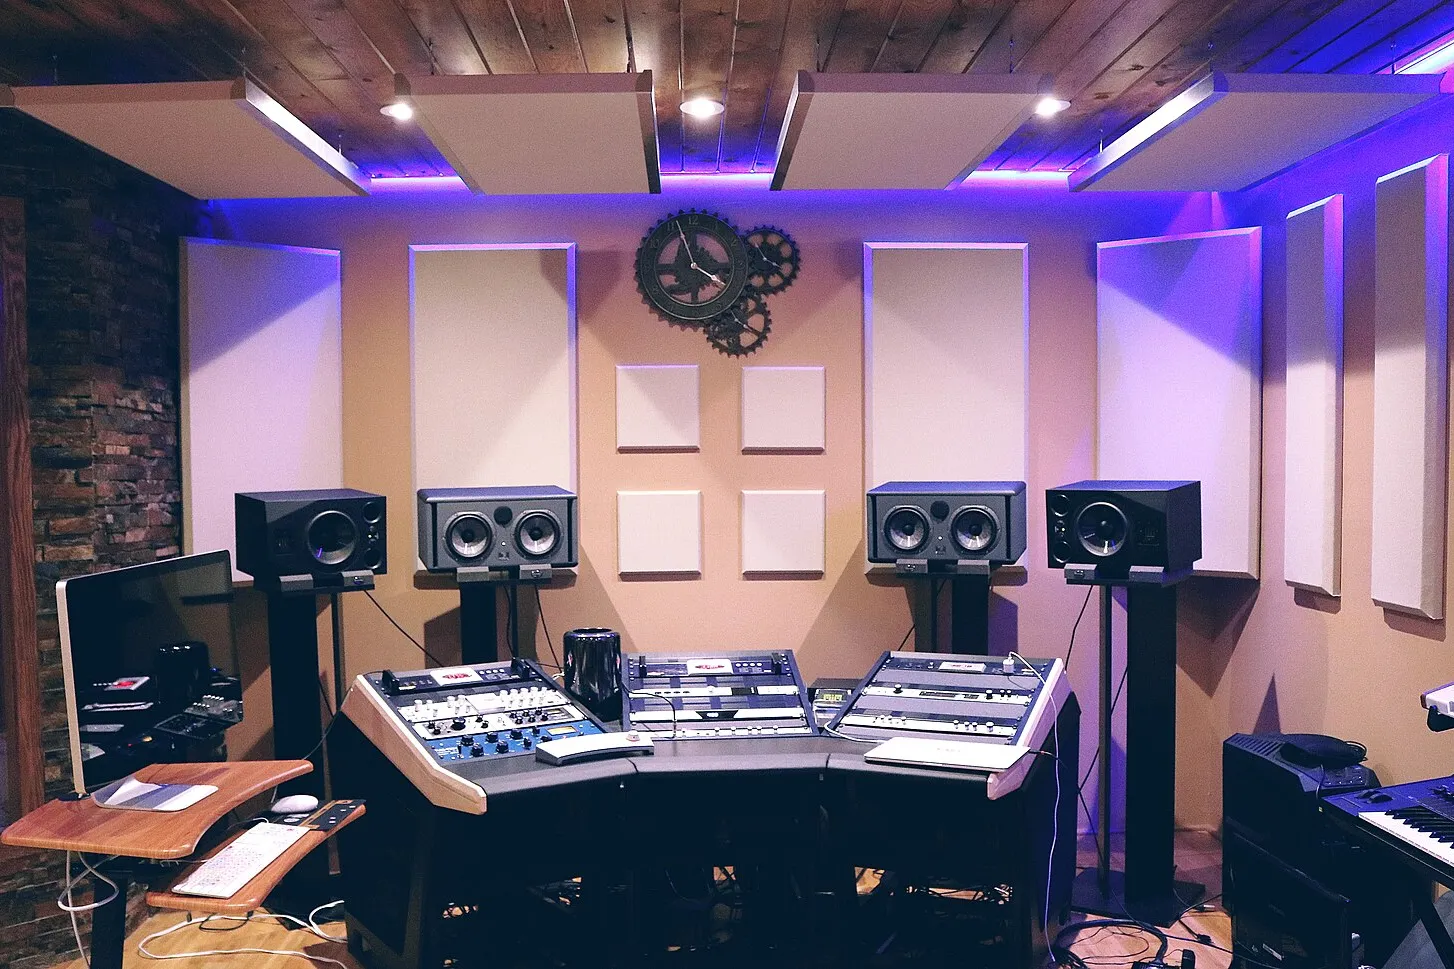
Sound studio workstation. Photo Dayron Villaverde, CC0, via Wikimedia Commons.
According to the estimates of the AI Impact Database, a year of AI use at work consumes from 0.48 kWh at the servers for a field occupation to 7.4 kWh for a videographer, 15 times more. The ranking follows one or two heavy tasks per occupation, such as video, interview transcription or continuous code suggestions, more than the number of requests. With coding agents, the order of magnitude changes: about 400 kWh for a developer who delegates work to them.
Contents
The figures that circulate on the electricity use of AI concern one question, one image, one video. For an organisation, the useful unit is rather a year of work: an accountant, a journalist or a developer do neither the same tasks nor at the same frequency. The AI Impact Database describes 18 occupations in this way, through a task basket: for each task, how often it recurs in the occupation, what share of it is done with AI, and the electricity it consumes at the servers.
These frequencies are assumptions made by Projet Celsius. For some of the tasks, they rely on the frequency reported by those who hold the occupation in O*NET, the occupation database of the US Department of Labor, which gives it in 7 classes, from "once a year or less" to "every hour or more". The share done with AI starts, for each task, from a value common to all occupations. It is adjusted to the occupation according to the Microsoft study of 200,000 conversations with Bing Copilot, which measures to which activities of each occupation AI applies and not how many people use it. It also relies on usage surveys: the Baromètre du numérique, the Stack Overflow survey of developers and the study by OpenAI and economists from Harvard and Duke on messages sent to ChatGPT. The transcription of interviews, which makes up half of the journalist's year and a third of the video producer's, rests on an assumption without a survey. The years on this page are therefore estimates ; they describe the current use of the database, that of the median user of an occupation who uses AI.
The electricity of the servers that process each request, including the cooling of the data centre, over a year of 220 working days.
The manufacture of servers and chips, the training of models, the network, the person's computer, and agents, which are treated separately below.
From 0.48 to 7.4 kWh per year depending on the occupation
The electricity of a year of AI, in kWh at the servers, and the task that weighs the most in each occupation (estimates from the AI Impact Database):
The video producer comes out on top with 7.4 kWh, ahead of the journalist, 4.6 kWh, and the developer, 4.3 kWh. The field occupation, technician or carer, comes last with 0.48 kWh: it mostly writes reports. Between the 2 extremes, the gap is from 1 to 15. The office worker, the generic profile of the database, sits in the middle, at 1.3 kWh; everyday personal use, outside work, at 0.75 kWh.
Each year has a range, which follows the low and high values of the electricity of each task, at equal frequencies: from 1.12 to 1.15 kWh for the lawyer, from 1.7 to 9.8 kWh for the graphic designer, depending on the model that generates the visuals. It does not cover the uncertainty on frequencies and on the share done with AI, which weighs more: the database also describes a frugal use, with about 3 times fewer tasks delegated to AI, and an intensive use, with 3 to 4 times more, which the entry for each occupation lets you choose.
One or two tasks determine the ranking
The electricity of a task ranges from 0.07 Wh for a code suggestion to 340 Wh for a 10-second video clip, a ratio of almost 5,000. A quick question consumes 0.3 Wh, the transcription of a one-hour meeting with its summary 30 Wh, a 5-second clip 99 Wh, as much as 330 quick questions. An occupation weighs heavily when a task from the top of this scale recurs often in its year, or when a light task recurs tens of thousands of times.
| Occupation | Task that weighs the most | Times per year with AI | Share of the year |
|---|---|---|---|
| Customer account manager | Handle a customer request | 1,056 | 61 % |
| Teacher | Prepare a one-hour lesson | 53 | 58 % |
| Data scientist | Get a code suggestion | 26,400 | 57 % |
| Developer | Get a code suggestion | 35,200 | 56 % |
| Journalist | Transcribe and summarise a one-hour interview | 79 | 51 % |
| Office worker | AI-assisted web search | 220 | 47 % |
| Field worker | Write meeting minutes | 145 | 43 % |
| Graphic designer | Create a visual in 4 attempts | 88 | 38 % |
| Videographer | Transcribe and summarise one hour of raw footage or interview | 79 | 32 % |
Estimates from the AI Impact Database, engine 0.3.1, default settings. "Times per year": frequency in the occupation multiplied by the share done with AI.
For the journalist, 79 interviews transcribed and summarised make up half of the year: the database assumes 3 one-hour interviews per week, of which 60% go through AI. For the developer, these are 35,200 code suggestions, 200 opportunities per day, of which 80% with an AI suggestion; each weighs little, their number makes the total. The video producer transcribes as much as the journalist, 79 hours of raw footage or interviews in the year, or 32% of their year; their 29 generated clips make up 60% of it, and a single 10-second clip consumes as much as 1,100 quick questions.
Web search in 6 office occupations
In 6 of the 18 occupations, the office worker, the executive assistant, the human resources officer, the accountant, the sales representative and the communications officer, the heaviest task is web search delegated to an assistant: from 25% to 47% of the year. A search of this type consumes 2.7 Wh in the database, 9 times the 0.3 Wh that Google gave in 2009 for a conventional search: the assistant launches 2 searches and reads 5 pages before answering.
Emails, often cited, weigh little: 3 to 40 per day depending on the occupation, of which 7 to 13% written with AI in the database, at 0.23 Wh each. They make up 20% of the year of the manager, who writes the most, and less than 13% for the others. Our analysis of the actions quantifies what choosing a conventional search changes over a year, when it is enough.
Coding agents
The years above count an assistant that you question. With coding agents, which chain dozens of steps on their own, the order of magnitude changes: the database counts 594 hours of agent time in a developer's year, which takes it from about 4 to about 400 kWh. These hours depend on the tool that the organisation makes available; in the database, only the developer and the data scientist count them. The analysis over a year of use details the agent hour, the readings on which it relies and the formulas that count it.
In CO2e, from 0.2 to 3.4 kg a year
With the world average electricity of 2025, 458 gCO2e per kWh, these years range from 0.2 kgCO2e for the field occupation to 3.4 kgCO2e for the video producer. If the servers ran in France, at 41 gCO2e per kWh according to Ember, they would range from 20 to 305 gCO2e; a Bilan Carbone® in France uses the ADEME value, 51.9 gCO2e per kWh. The video producer's year makes up 0.04% of the annual carbon footprint of a French person, 8.3 tCO2e in 2025; the developer's with agents, about 180 kgCO2e, makes up 2%.
For a team, the calculation is done by addition: 12 office workers represent 15 kWh per year in the database, about 7 kgCO2e. Our analysis of the Bilan Carbone® says where these emissions fall in an organisation's footprint.
Limits of the estimate
The task frequencies are assumptions: 3 interviews per week for a journalist or 40 emails per day for a manager describe an average occupation, from which a person may differ greatly. The share done with AI relies on American conversations with Bing Copilot in 2024, on messages sent to ChatGPT worldwide up to 2025 and on surveys from 2025 of developers and of French people; when it rises, every year on this page rises with it. The 18 occupations do not cover all work: they describe office, creative and teaching occupations, and a generic field occupation.
The calculation counts only the electricity of the servers during use. The manufacture of hardware and the training of models come on top of it; the entry for an occupation's year in the database says what is counted and what is not, and anyone can change the frequencies in it to find their own case.
Our reading
At Projet Celsius, we see the occupation as giving a first order of magnitude of the use of AI in an organisation, from less than one to a few kilowatt-hours per person per year for the use of an assistant. What changes this order of magnitude is rarely visible in the organisation chart: agent hours, generated video, systematic transcription of meetings. To count the AI of an organisation, we therefore start from its tools and their volumes rather than from its headcount by occupation, and we keep the occupation to check that the total is plausible.
All the years on this page are estimates from the AI Impact Database, built on assumptions about frequency and about the use of AI; none is measured. They describe current use, that of the median user; intensive use multiplies them by 3 to 4. They count only the electricity of the servers during use.
Sources
8 documents
- National Center for O*NET Development, US Department of Labor, O*NET 30.1 Database, Task Statements and Task Ratings2025entry 403
- Tomlinson, Jaffe, Wang, Counts and Suri, Working with AI: Measuring the Applicability of Generative AI to Occupations, Microsoft Research2025entry 404
- Chatterji, Cunningham, Deming, Hitzig, Ong, Shan and Wadman, How People Use ChatGPT, NBER Working Paper 342552025entry 405
- Arcep, Arcom, CGE and ANCT, Baromètre du numérique2026entry 57
- Stack Overflow, 2025 Developer Survey, AI2025entry 406
- Our World in Data, based on Ember, Lifecycle carbon intensity of electricity2026entry 34
- SDES and Insee, L'empreinte carbone de la France de 1990 à 20252026entry 53
- Zeke Hausfather, The real energy use of agentic AI, The Climate Brink2026entry 120
Every figure was read in its source; the hub's methodology is described in Methodology and sources.
AI Impact, Projet Celsius, "Which tasks make up the AI footprint by occupation?", 13 November 2026. https://projetcelsius.com/en/ai/analyses/ai-footprint-by-job-and-task/

 Society















