

Electricity used by a question, an image, a video
Server electricity per task, in watt-hours, counted in written questions
Electricity used by a question, an image, a video
Sources
Source: Epoch AI; Luccioni et al.; Delavande et al.. projetcelsius.com/en/ai · CC BY 4.0- Epoch AIHow much energy does ChatGPT use?February 2025 (new tab)
- Hugging Face and Carnegie MellonLuccioni, Jernite et Strubell, Power Hungry Processing: Watts Driving the Cost of AI Deployment?2024 (new tab)
- Hugging FaceDelavande, Pierrard et Luccioni, Video Killed the Energy BudgetSeptember 2025 (new tab)

The analysis
- An image costs about 10 times a question; a 5-second video about 300 times, with the most downloaded open generator.
- For video, measurements range from 0.14 to more than 415 Wh depending on the model. The value used is that of the most downloaded generator, the second most power-hungry of the 7 measured.
The figures
- Each square equals one written question, 0.3 Wh: the video counts 300 (90 / 0.3), the image 9.7, rounded to 10 in the drawing.
- Written question: 0.3 Wh.
- Image: 2.9 Wh.
- 5 s video: 90 Wh.
Assumptions
- Server electricity at the time of use, excluding training and users' devices.
- 3 studies, 3 protocols: orders of magnitude, not a comparison to the nearest gram.
- No company publishes a measurement for images or videos from its own generators.
- Model training and hardware manufacturing are not counted.
More on uses
The whole Uses topic →Charts and maps
Chart UsesElectricity used by a generated video, 7 models measured× 3,000from 0.14 Wh to over 415 Wh per videoChartUsesElectricity by type of AI taskover1,000timesimage generation versus text classificationChartUsesReasoning mode multiplies energy useChartUsesEnergy savings from 4 settings10times as muchsaved by shortening the response rather than the instruction
Analyses
 Where does this figure come from?Uses20 October 2026"A generated image is a phone charge"The comparison did the rounds of the media in late 2023. It came from a serious study, but from its preliminary version, from the most power-hungry generator, and from a phone charge counted as 12 Wh.
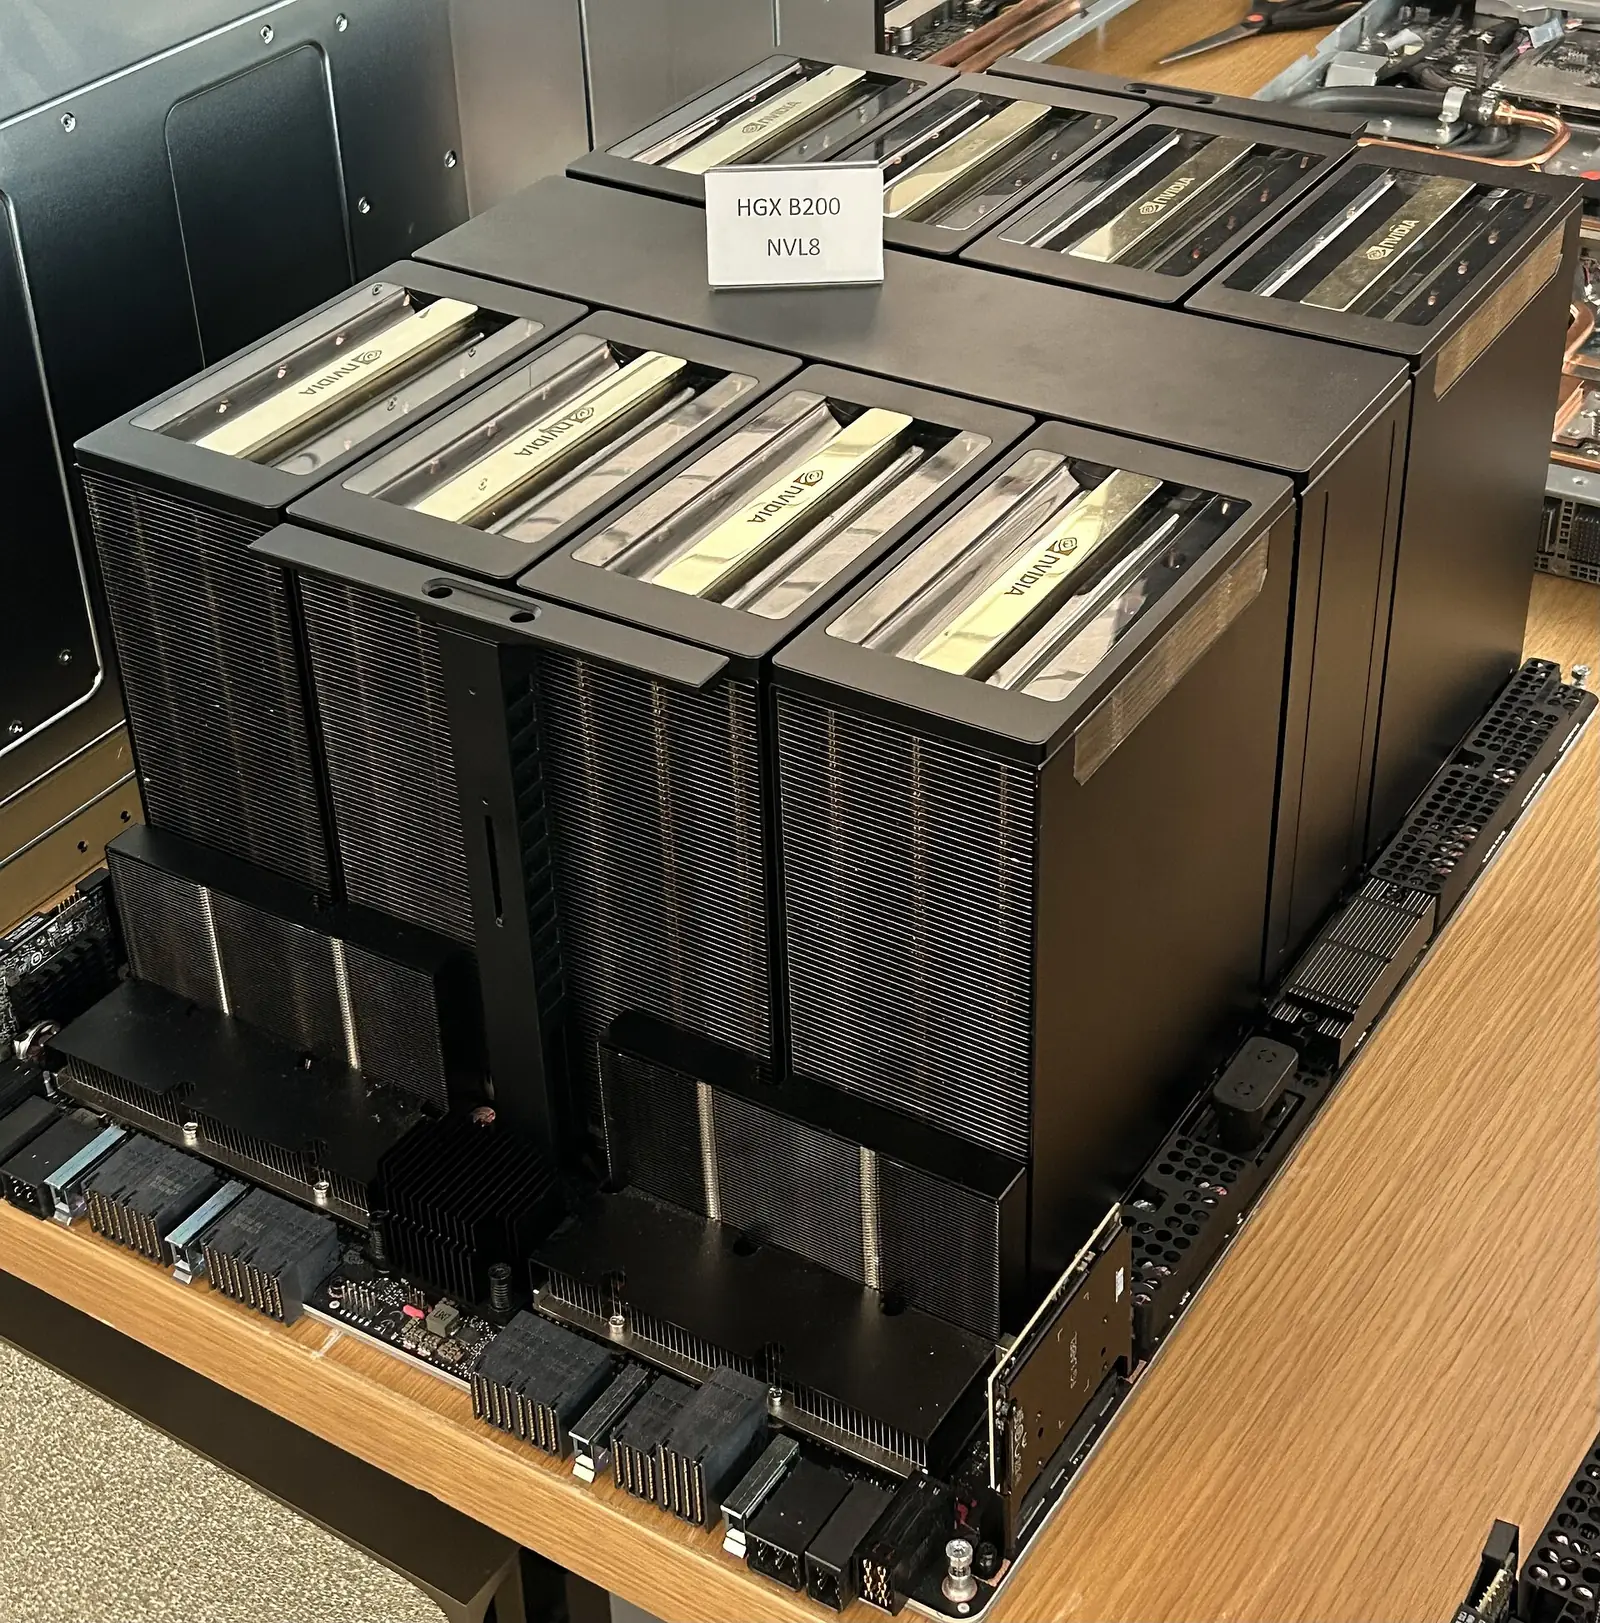 Where does this figure come from?Uses20 October 2026"A generated video uses 1 kWh"The figure has been circulating since 2025, often attached to Sora. It comes from a real measurement, but one made on a different, open model, in a particularly heavy version. Measurements of 7 generators range from 0.14 to 415 Wh.
Tools

On the Projet Celsius blog ↗
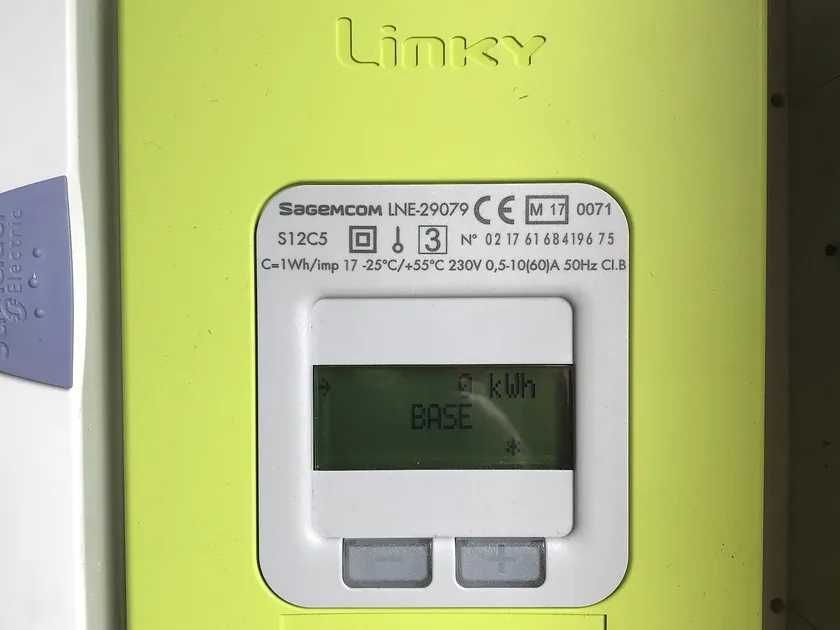
 Electricity
Across the hub
 AI Impact DatabaseAll the figures, their methodology and their sources.
 AI Ranking10 assistants rated out of 100: performance, ethics and environment.


 AnalysesThe signed pieces: analyses, viewpoints, "Where does this figure come from?".
 Charts and mapsYou are hereThe reference visuals, with their data and sources.
 ToolsOpen calculations, your assumptions on the left, the result on the right.






A question about a figure?
An error, a source to add, a methodology question, a press request: write to us. Guillaume Pakula, Clément Reynaud, Sébastien Pierfederici and Alexandre Veilly will reply.
Write to us →
Projet Celsius, which runs this hub, also helps companies measure and reduce the footprint of their AI use.
Accounting for AI in your Bilan Carbone® ↗





