

Energy savings from 4 settings
Energy avoided relative to the initial request, in %
Energy savings from 4 settings
Sources
Source: UNESCO and UCL, 2025; Barros et al., 2025. projetcelsius.com/en/ai · CC BY 4.0
The analysis
- What weighs is what the model writes, not what is written to it: shortening the response saves 10 times more than shortening the instruction.
- Choosing the smallest sufficient model for each task would cut the energy of all AI uses by about a quarter, according to a study from 2025.
- Over a year and for the usage profile of the series (10 questions a day, 5 images and 1 video a week), video weighs more than all the other uses combined.
The figures
- Response 4 times shorter (UNESCO and UCL): 76 %.
- Response 2 times shorter (UNESCO and UCL): 54 %.
- Smallest sufficient model (Barros et al., all uses): 28 %.
- Instruction 2 times shorter (UNESCO and UCL): 5 %.
Assumptions
- Server energy at the time of the response.
- Measurements on specific models and tasks: the gains vary from one service to another.
- These gains apply to a single request; they say nothing about the effect of more frequent use.
More on uses
The whole Uses topic →Charts and maps
Chart UsesElectricity used by a question, an image, a videoabout300timesa 5-second video versus one questionChartUsesElectricity used by a generated video, 7 models measured× 3,000from 0.14 Wh to over 415 Wh per videoChartUsesElectricity by type of AI taskover1,000timesimage generation versus text classificationChartUsesReasoning mode multiplies energy use
Analyses
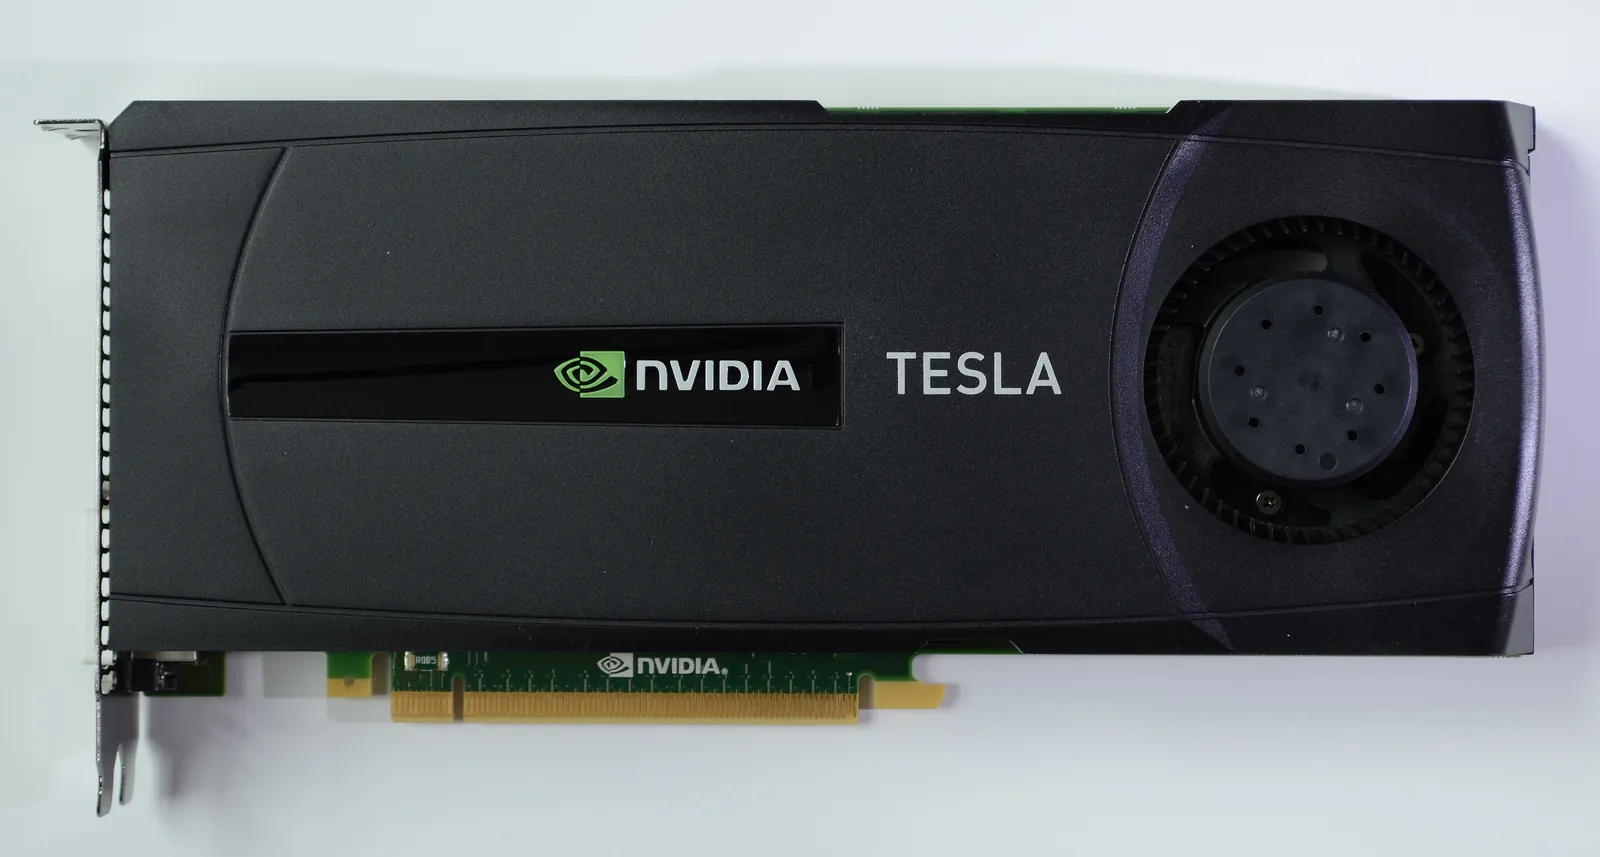 Where does this figure come from?Uses20 October 2026"A generated image is a phone charge"The comparison did the rounds of the media in late 2023. It came from a serious study, but from its preliminary version, from the most power-hungry generator, and from a phone charge counted as 12 Wh.
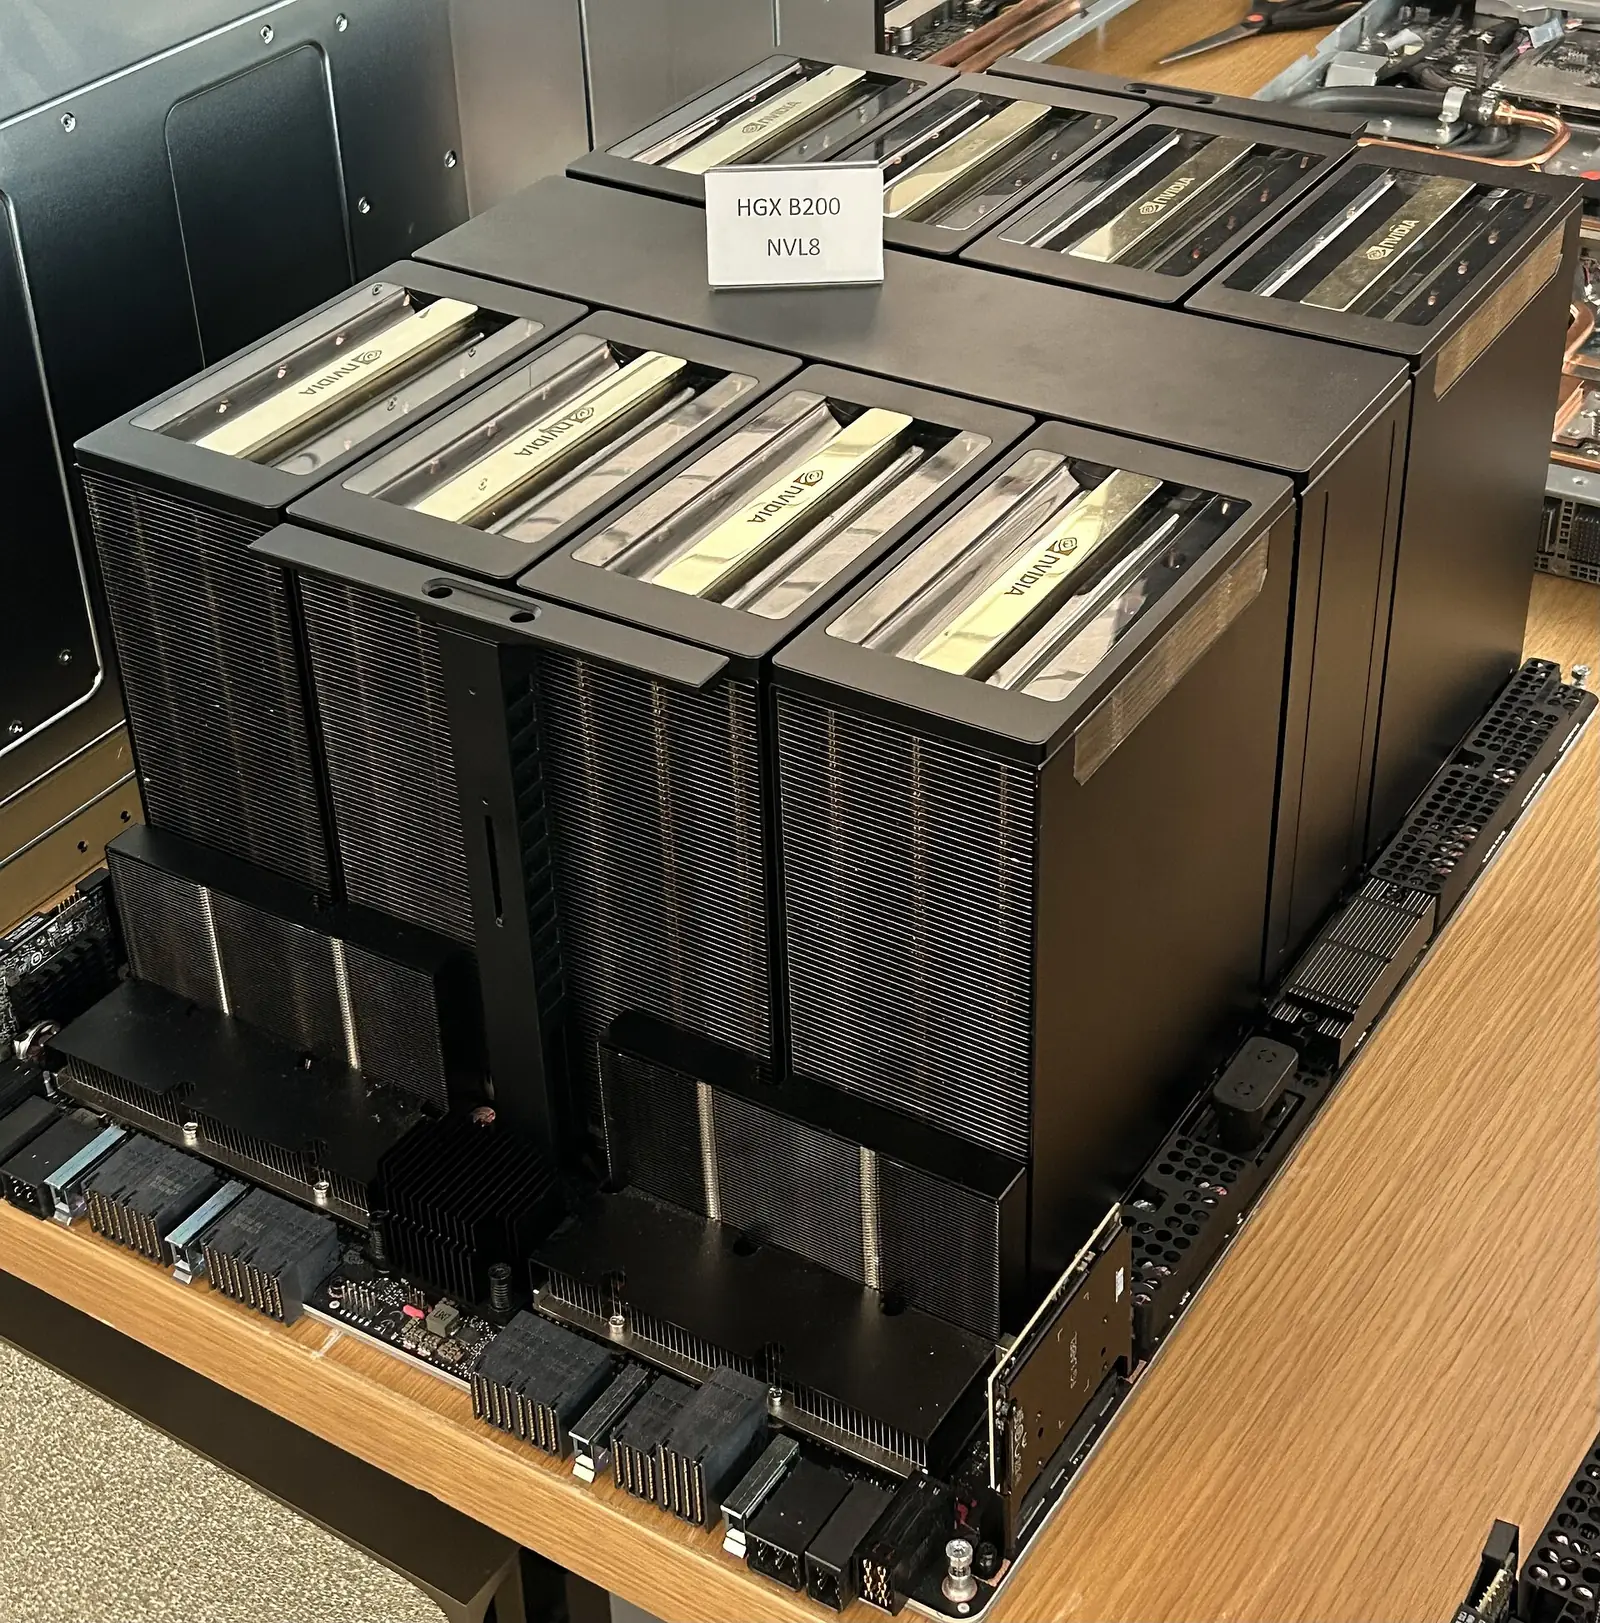 Where does this figure come from?Uses20 October 2026"A generated video uses 1 kWh"The figure has been circulating since 2025, often attached to Sora. It comes from a real measurement, but one made on a different, open model, in a particularly heavy version. Measurements of 7 generators range from 0.14 to 415 Wh.
Tools

On the Projet Celsius blog ↗
Across the hub
 AI Impact DatabaseAll the figures, their methodology and their sources.
 AI Ranking10 assistants rated out of 100: performance, ethics and environment.


 AnalysesThe signed pieces: analyses, viewpoints, "Where does this figure come from?".
 Charts and mapsYou are hereThe reference visuals, with their data and sources.
 ToolsOpen calculations, your assumptions on the left, the result on the right.






A question about a figure?
An error, a source to add, a methodology question, a press request: write to us. Guillaume Pakula, Clément Reynaud, Sébastien Pierfederici and Alexandre Veilly will reply.
Write to us →
Projet Celsius, which runs this hub, also helps companies measure and reduce the footprint of their AI use.
Accounting for AI in your Bilan Carbone® ↗





