

Focus · AI and climate
2030 trajectories
The electricity that powers servers, country by country, and the place of digital technology in emissions.
By Projet Celsius
 Focus areaAI emissions1.14gCO2efor a Le Chat answer of about one page, over the full life cycleMistral AI, July 2025Open the focus area →
 Focus areaScenarios and uncertaintiesThe calculation methods, which put the same question at anywhere from 0.012 to 1.14 gram of CO2e.Open the focus area →You are here2030 trajectories458gCO2e/kWhfor one kWh of electricity in the world in 2025, over the life cycleEmber
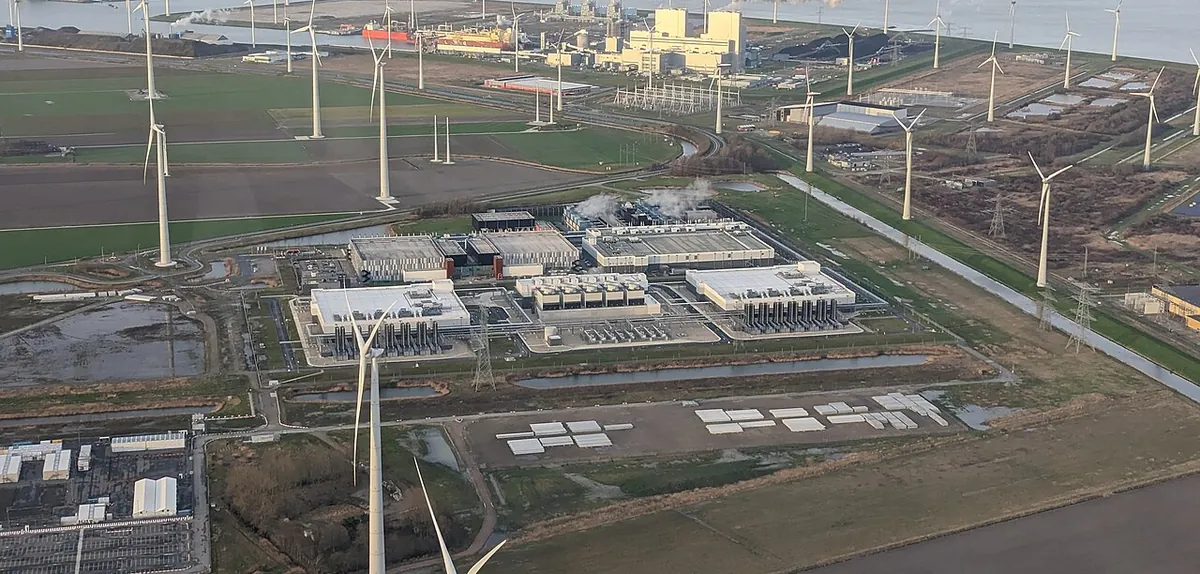
Google's data centre in Eemshaven (Netherlands), in the middle of a wind farm. Photo Wvdp, Wikimedia Commons, CC0, cropped
Charts and maps of the focus area
Charts and maps →Focus area
ChartCountries · 2025Server electricity, country by countryFranceWorldPoland589gCO2e/kWhPoland; France: 41.4Ember, 2026, via Our World in DataKey figureWorld · 2025Carbon intensity of world electricity458gCO2e/kWhLife cycle, AI Impact DatabaseEmber, 2026ChartWorld · 2023 to 2030AI emissions, comparedBelgium, 202498IA, 202599France, 2024367IA, 2030636Aviation, 2023882 Mt99MtAI in 2025, like BelgiumGreenIT; Eurostat; Citepa; ATAGKey figureFrance · 2025Carbon intensity of electricity in France41.4gCO2e/kWhLife cycle, electricity generatedEmber, 2026
Show the next 3
Chart2022 (January 2025 study)The digital sector in France, in 3 categoriesDevices14.6 MtData centres13.8 MtNetworks1.1 MtADEME, January 2025, 2022 dataKey figureFrance · 2022The digital sector's share of France's carbon footprint4.4%434 kgCO2e per person in France per year2022 data, 29.5 MtCO2eADEME, January 2025MapWorld · 2025The carbon intensity of electricityNorway 28France 41Poland 589gCO2e/kWh458gworld average, life cycleEmber, via Our World in Data
Analyses and articles
Analyses
 Where does this figure come from?
 Climate20 October 2026"Meta's electricity emits only 1,358 tonnes of CO2e"In 2024, Meta reports 1,358 tonnes of CO2e for the electricity it buys, the annual footprint of 170 people in France. The same report also gives 5.97 million tonnes. Both of the 2 figures are accurate.
 AnalysisClimate12 November 2026Why do estimates of AI's impact differ?Calculated with French electricity, one question to an AI emits 0.012 gram of CO2e; Mistral AI publishes 1.14 gram, more than 90 times as much. Its water use ranges from 0.26 to 45 millilitres depending on the published measurements. These figures are accurate; they do not cover the same scope.
On the Projet Celsius blog ↗

Sources for this focus area
- Ember, Global Electricity Review 2026, and annual data via Our World in Data ↗
- Our World in Data, based on Ember, Lifecycle carbon intensity of electricity ↗
- GreenIT, Impacts environnementaux et sanitaires de l'intelligence artificielle dans le monde en 2025 et 2030, September 2026 ↗
- Eurostat, greenhouse gas emissions (env_air_gge) ↗
- Citepa, Secten 2026 report ↗
- ATAG, Facts and figures, aviation emissions 2023 ↗
- ADEME, Évaluation de l'impact environnemental du numérique en France, January 2025 ↗
Across the hub
 AI Impact DatabaseAll the figures, their methodology and their sources.
 AI Ranking10 assistants rated out of 100: performance, ethics and environment.


 AnalysesThe signed pieces: analyses, viewpoints, "Where does this figure come from?".
 Charts and mapsThe reference visuals, with their data and sources.
 ToolsOpen calculations, your assumptions on the left, the result on the right.






A question about a figure?
An error, a source to add, a methodology question, a press request: write to us. Guillaume Pakula, Clément Reynaud, Sébastien Pierfederici and Alexandre Veilly will reply.
Write to us →
Projet Celsius, which runs this hub, also helps companies measure and reduce the footprint of their AI use.
Accounting for AI in your Bilan Carbone® ↗





