

 Electricity13 November 2026
Where is the best place to build a data centre?
Electricity, water, climate, grid and heat, country by country




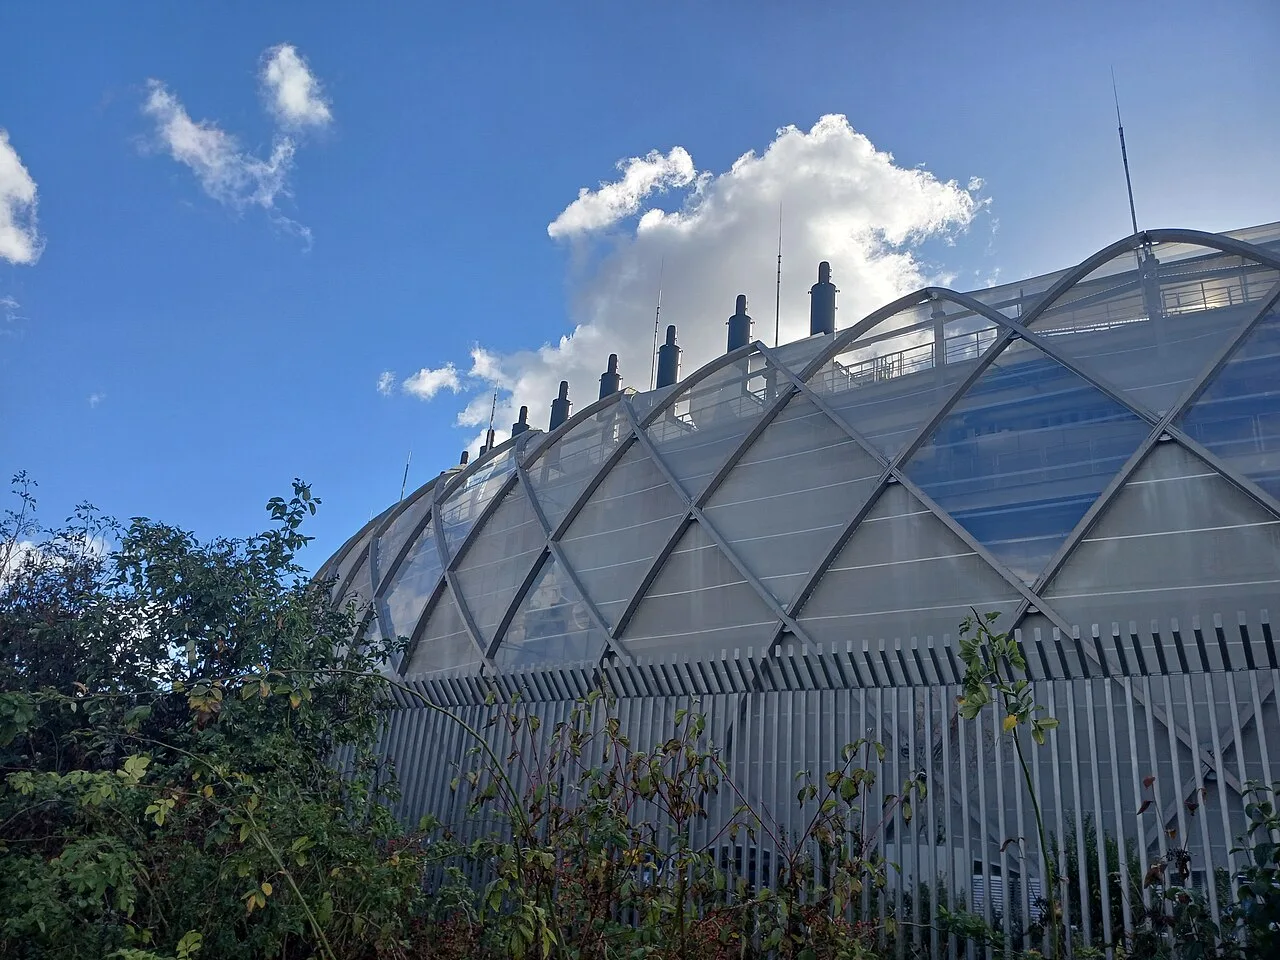
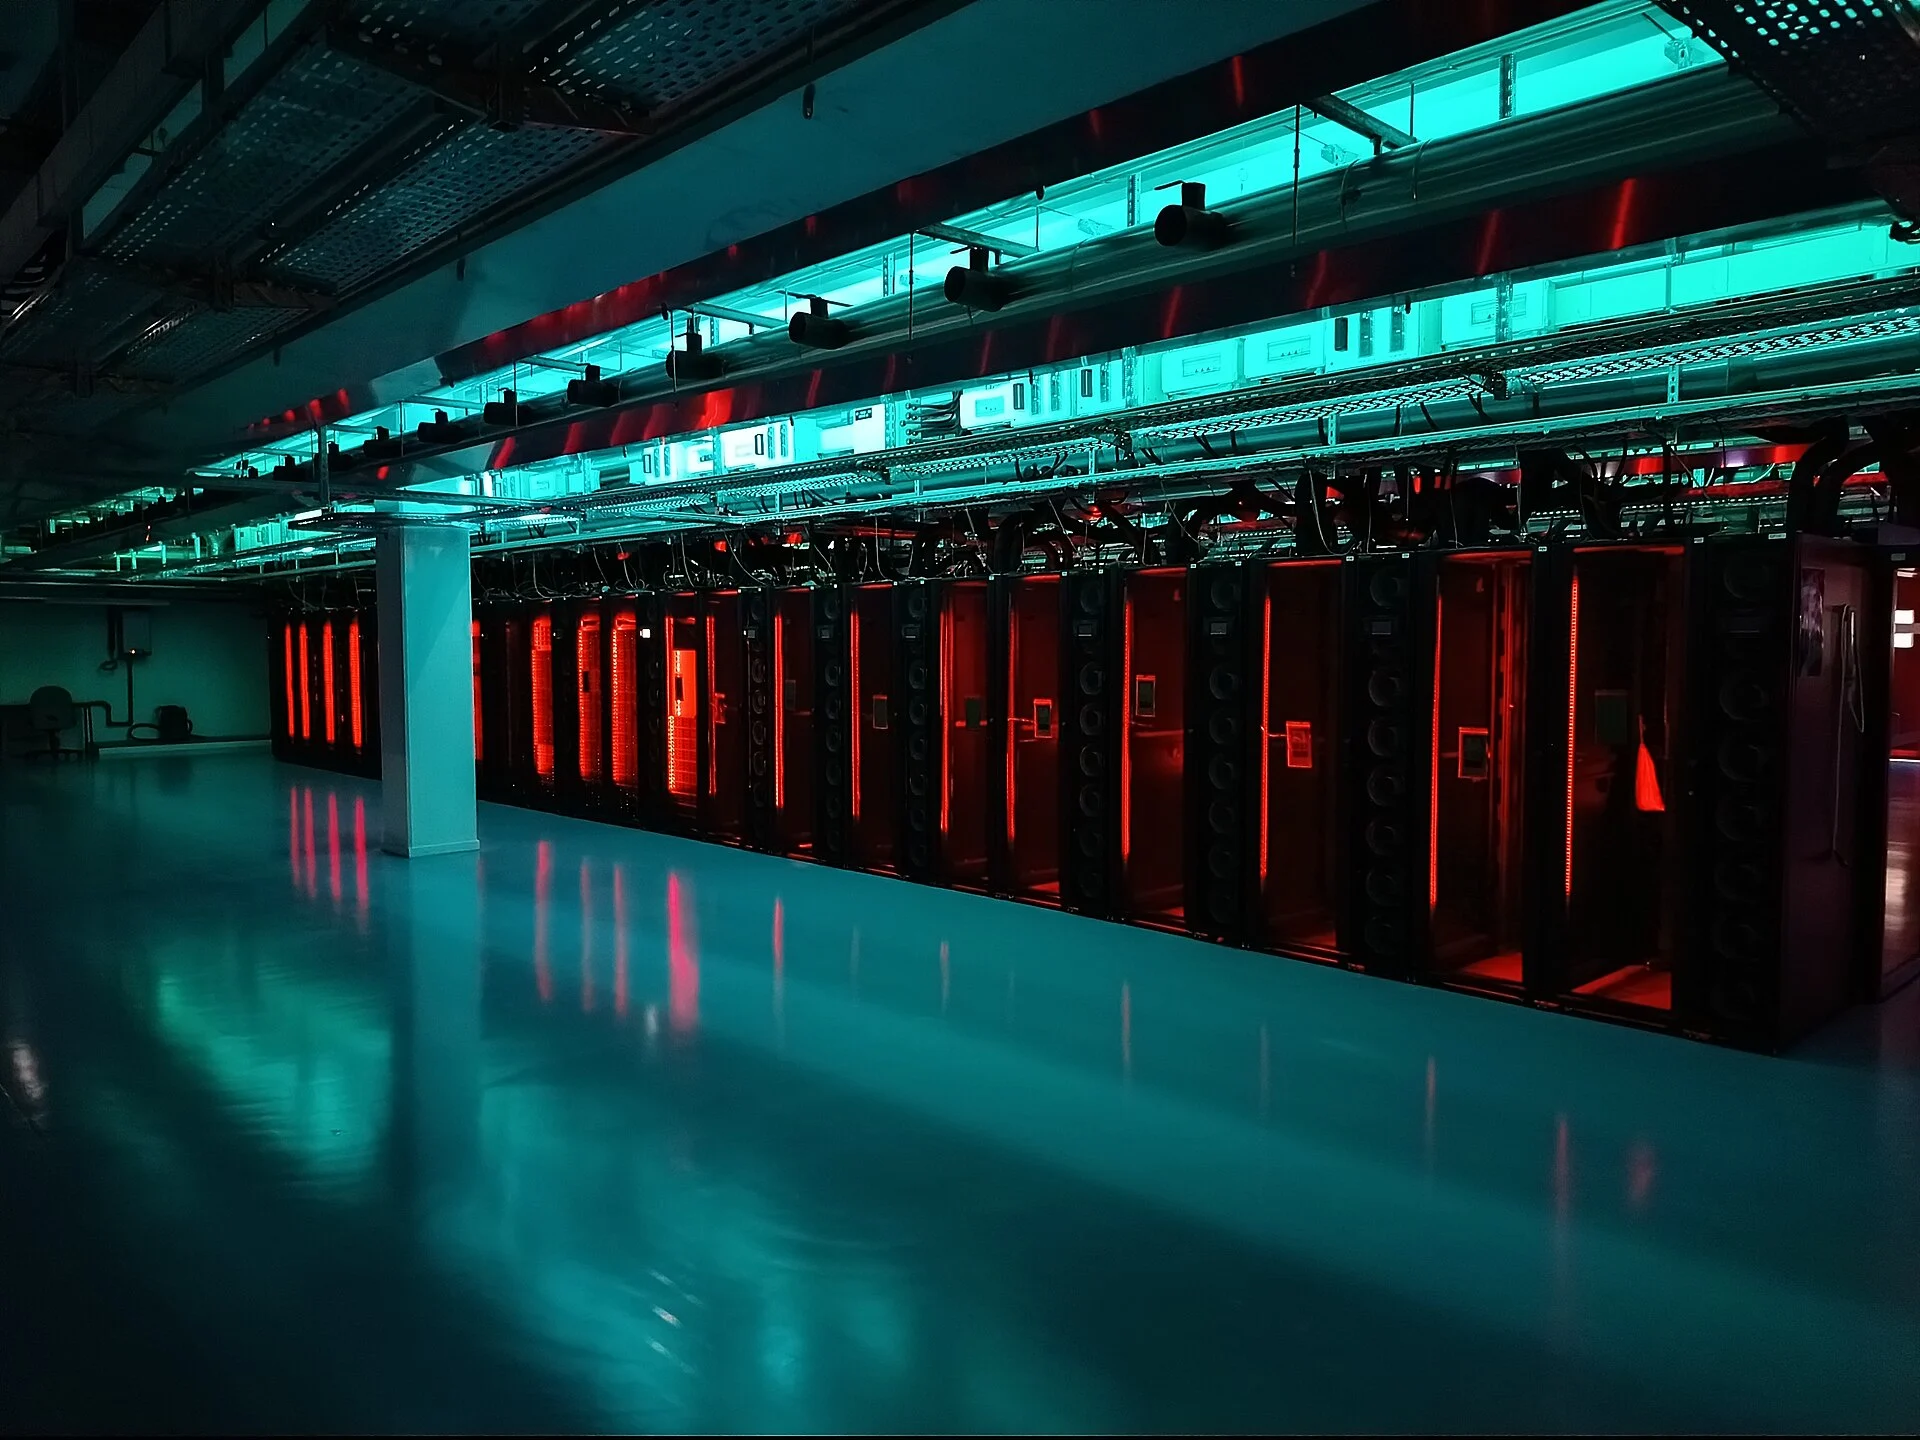
The Paris Digital Park, a Digital Realty data centre campus at La Courneuve (Seine-Saint-Denis), in October 2026. Photo: Guallendra, CC0, via Wikimedia Commons.
For the emissions of its electricity, the country of a data centre matters more than any other criterion: the same consumption emits 14 times more in Poland than in France and 21 times more than in Norway. Climate changes the efficiency of a centre to a lesser extent, water depends on the cooling method and the river basin, and the electricity grid decides where a centre can connect, and when.
Contents
A data centre consumes electricity, water for part of its cooling, and a place on the electricity grid; it gives off heat. The place where it is built determines the origin of its electricity, the climate that cools it, the water available, the capacity of the grid and whether there is an outlet for its heat. These 5 criteria cannot be measured on the same scale. For emissions, electricity weighs far more than climate; water is assessed river basin by river basin; the grid determines which locations are possible and the lead times.
The emissions counted here are those of the electricity consumed, converted using the average intensity of each country's grid. An operator may buy renewable electricity under contract; the contracts and grid chart shows the gap between the 2 accounts; the hub follows the actual grid.
The emissions of electricity vary from 1 to 21 depending on the country
In 2025, producing 1 kWh of electricity emitted 28 gCO2e in Norway, 41 in France and 589 in Poland, on a life-cycle basis. For 1 GWh consumed, this comes to 28 tonnes of CO2e in Norway, 41 in France, 330 in Germany and 589 in Poland: 14 times more in Poland than in France, 21 times more than in Norway; the countries chart gives the others. The hub tool repeats this calculation for a use of AI, with 12 countries and zones.
| Country | Electricity, gCO2e per kWh, 2025 | Low-carbon share of generation, 2025 | Water stress, 2023 |
|---|---|---|---|
| Norway | 28 | 99 % | 2 % |
| Sweden | 35 | 99 % | 4 % |
| France | 41 | 95 % | 21 % |
| Finland | 58 | 96 % | 7 % |
| Denmark | 114 | 91 % | 27 % |
| Belgium | 150 | 72 % | 53 % |
| Spain | 154 | 75 % | 43 % |
| Netherlands | 254 | 54 % | 15 % |
| Ireland | 257 | 48 % | 9 % |
| Germany | 330 | 59 % | 32 % |
| Poland | 589 | 32 % | 33 % |
Intensity and low-carbon share: electricity produced in the country, life cycle (Ember, via Our World in Data). Water stress: freshwater withdrawals as a proportion of renewable resources, after the needs of ecosystems (FAO, SDG indicator 6.4.2); the FAO speaks of stress above 25%. National averages of withdrawals: stress plays out river basin by river basin, and water returned to the environment is counted in them.
Low-carbon electricity can be scarce. A high share of nuclear, hydropower or wind does not mean that generation remains available for new centres: a large project may call on more emitting power stations in addition, in the country or among its neighbours.
Climate changes efficiency to a lesser extent
A cold climate makes it possible to cool servers with outside air for a larger part of the year, and reduces the electricity used for cooling. The efficiency of a centre is measured by its power usage effectiveness (PUE): the total electricity of the site divided by that of the servers. In 2026, the average PUE reported to the Uptime Institute by operators around the world is 1.52.
In 2025, Google's 5 European campuses have a PUE of 1.07 to 1.10, from Fredericia, in Denmark, to Hamina, in Finland; the reported industry average is 1.52.
At Google, whose European campuses are all in cool or temperate climates, total electricity varies by 3% from one campus to another. Between the industry average and the best of these campuses, it varies from 1 to 1.4. From one European electricity grid to another, the emissions of the same electricity vary from 1 to 21. None of these campuses is in Southern Europe: the sample does not measure the effect of a hot climate.
Water depends on cooling and on the river basin
The water consumption of a centre depends on its cooling method. In 2025, Google's air-cooled campus in Dublin consumed 0.1 million gallons of water, a few hundred m³. The one at Saint-Ghislain, in Belgium, consumed 451 million, about 1.7 million m³: of the 714 million gallons it withdraws, it returns 264 million. The 2 campuses have the same PUE of 1.08. The volumes are not related to the electricity use of the sites, whose size differs.
The map of water stress shows where water is already under pressure. Saint-Ghislain is in Belgium, where withdrawals reach 53% of available resources, the highest level among the countries in the table; Norway is at 2%. These national averages hide the differences between river basins, which matter more for a given site.
The electricity grid decides which locations are possible
The grid decides where a centre can connect and when. In the 5 large historic European hubs, Frankfurt, London, Amsterdam, Paris and Dublin, connecting a data centre takes 7 to 10 years on average, and up to 13 years, according to the think tank Ember.
Ireland shows what happens when projects are concentrated: data centres there consumed 23% of the electricity measured at meters in 2025, compared with 5% in 2015 (chart). A decision of the Irish regulator published on 12 December 2025 requires centres of at least 10 MVA to have dispatchable generation or storage, on site or nearby, in line with their connection capacity, and to cover at least 80% of their annual consumption with new renewable electricity produced in Ireland, within 6 years of being energised. In France, the Commission de régulation de l'énergie approved in May 2025 a fast-track connection procedure for consumers of 400 MW to 1 GW, for 2028-2029, on sites identified beforehand by the State.
Last criterion: the heat released has value only if a heat network exists nearby and has demand at the same time. The explainer on the heat of data centres shows why it remains little used in Europe.
Our reading
For us, at Projet Celsius, the first criterion for locating a data centre is the electricity it will draw: it determines the largest share of the emissions of its operation, since the manufacture of the servers and of the building does not depend on the country. The Nordic countries and France have some of the least carbon-intensive electricity in Europe; this advantage assumes that new centres do not draw on fossil-fuelled power stations in addition.
The average intensity of a country does not give the electricity that a new centre will draw: its consumption is added to that of the country, and may be met, at peak hours, by power stations that emit more than the average.
Sources
10 documents
- Our World in Data, based on Ember, Lifecycle carbon intensity of electricity2026entry 34
- Our World in Data, based on Ember, Share of electricity generation from low-carbon sources2026entry 35
- FAO, SDG indicator 6.4.2 (level of water stress), via Our World in Data2026entry 36
- Google, Data centers, Efficiency, PUE par campus2026entry 321
- Uptime Institute, Global Data Center Survey 20262026entry 324
- Google, 2026 Environmental Report2026entry 13
- Ember, Grids for data centres: ambitious grid planning can win Europe's AI race, 19 June 20252025entry 322
- Central Statistics Office (Ireland), Data Centres Metered Electricity Consumption 20252026entry 10
- Commission for Regulation of Utilities (Irlande), decision CRU/2025236, Large Energy User connection policy, 12 December 20252025entry 325
- Commission de régulation de l'énergie, press release on the fast-track connection procedure, 7 May 20252025entry 323
Every figure was read in its source; the hub's methodology is described in Methodology and sources.
AI Impact, Projet Celsius, "Où vaut-il mieux installer un centre de données ?", 13 November 2026. https://projetcelsius.com/en/ai/analyses/where-to-build-a-data-centre/

 Water















