

Focus · AI and electricity
Demand and projections
The electricity consumption of data centres and AI, and what projections announce for 2030.
By Projet Celsius
 Where does this figure come from?"By 2030, AI will consume as much as Japan"Read the analysis →You are hereDemand and projections945TWhfor the world's data centres in 2030, slightly more than Japan's current consumptionIEA, reference scenario
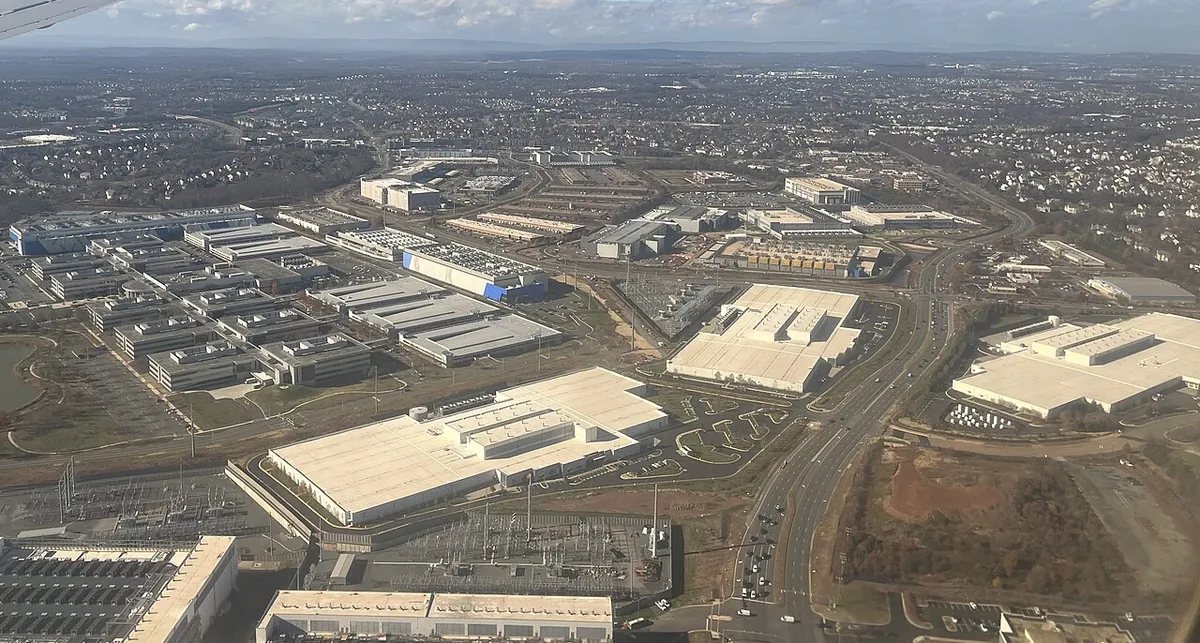 Focus areaData centres1.5%of the world's electricity consumed by data centres in 2024, or 415 TWhIEA, April 2025Open the focus area →
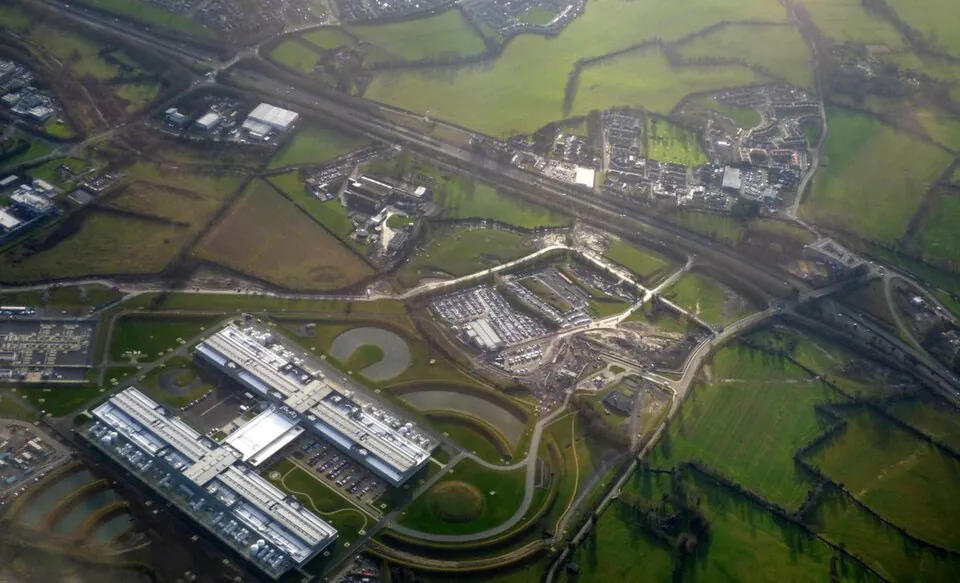 Focus areaElectricity grids23%of Ireland's electricity consumed by its data centres in 2025CSO, 2025See its charts →
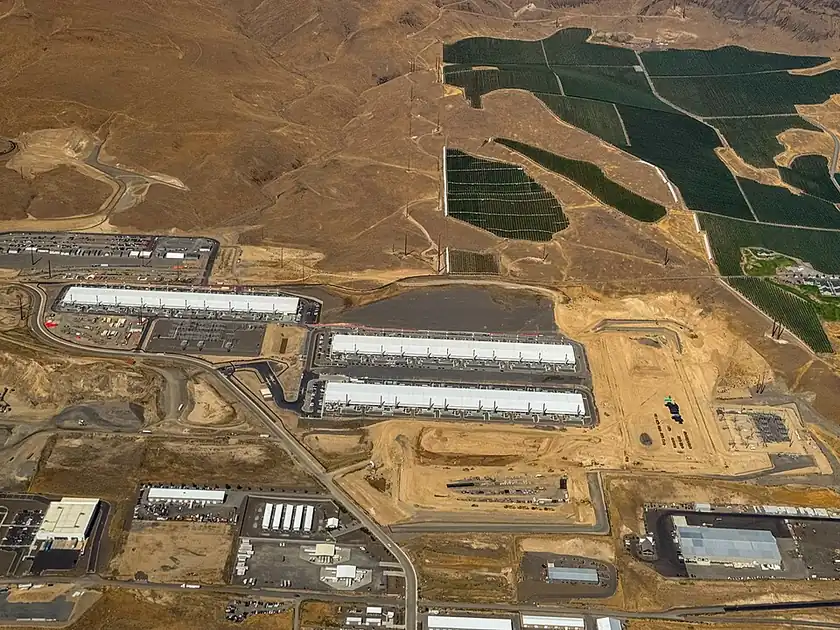
An Azure data centre campus in Washington State, with plots being levelled, seen from the air. Photo Tedder, Wikimedia Commons, CC BY 4.0
Charts and maps of the focus area
Charts and maps →Focus area
ChartWorld · 2030Data centre electricity consumption in 2030, according to 3 studiesIEA945GreenIT, AI1,169Shift Project1,250 to 1,50005001,0001,500 TWh1,250 to 1,500TWhthe highest, Shift ProjectIEA, 2026; Shift Project, 2025; GreenIT, 2026Key figureWorld · 2030Data centre electricity in 2030, baseline scenario945TWhAll uses, IEA scenarioIEA, April 2025ChartWorld · 2024 and 2030Data centre electricity945TWhin 2030, reference scenarioIEA, Energy and AI, April 2025Key figureWorld · 2025Electricity consumed by AI worldwide in 2025100 to 174TWh2 estimates, low and highSchneider Electric; GreenIT
Analyses and articles
Analyses
Where does this figure come from? Electricity20 October 2026"By 2030, AI will consume as much as Japan"The comparison comes from the International Energy Agency. It is correct, with 2 caveats: it covers all data centres, not AI alone, and it is one scenario among several.Viewpoint
 Society20 October 2026Surface AI and deep AIPublic debate looks at the AI people can see, the AI of chat windows. Its footprint is decided almost entirely below the surface, in an AI with no interface that can only be detected through the electricity grid.
On the Projet Celsius blog ↗

Sources for this focus area
- IEA, Energy and AI, April 2025 ↗
- IEA, Key Questions on Energy and AI, April 2026 ↗
- The Shift Project, Intelligence artificielle, données, calculs : quelles infrastructures dans un monde décarboné ?, October 2025 ↗
- GreenIT, Impacts environnementaux et sanitaires de l'intelligence artificielle dans le monde en 2025 et 2030, September 2026 ↗
- RTE, Bilan électrique 2025, February 2026 ↗
- ADEME, avis sur l'intelligence artificielle générative, July 2026 ↗
Across the hub
 AI Impact DatabaseAll the figures, their methodology and their sources.
 AI Ranking10 assistants rated out of 100: performance, ethics and environment.


 AnalysesThe signed pieces: analyses, viewpoints, "Where does this figure come from?".
 Charts and mapsThe reference visuals, with their data and sources.
 ToolsOpen calculations, your assumptions on the left, the result on the right.






A question about a figure?
An error, a source to add, a methodology question, a press request: write to us. Guillaume Pakula, Clément Reynaud, Sébastien Pierfederici and Alexandre Veilly will reply.
Write to us →
Projet Celsius, which runs this hub, also helps companies measure and reduce the footprint of their AI use.
Accounting for AI in your Bilan Carbone® ↗





