
- 1Three figures to remember: a transatlantic return flight = 1 tonne, gas heating for 100 m² = 2.5 tonnes.
- 2Misleading options: eliminating cups accounts for 0.01% of the footprint, switching off lights for 0.1 to 0.5%.
- 3The real opportunities: purchases (50 to 70% of the footprint); eliminating 3 executive committee flights accounts for only 0.2 to 1% of the service-sector footprint.
- 4France's electricity mix at 0.057 kgCO₂/kWh: electrifying in France divides the footprint by 4 to 7.
When a business leader tells me "we are going to eliminate plastic cups to reduce our footprint", I do not tell them it is pointless. I tell them it is 0.01% of their Bilan Carbone®, and that their executive committee's 3 transatlantic return journeys last year account for dozens of times more. It always has the same effect: silence, followed by "oh yes, quite a difference".
Act on what is visible or on what contributes most?
The number one climate problem in companies is not a lack of willingness. Most business leaders we support are sincerely committed. It is a lack of reference points. Without orders of magnitude, people act on what is visible - cups, sorting, email - rather than what really contributes. The result is a great deal of effort for very little effect. This article gives you the figures that change priorities.
1In companies: purchases and freight above all
This is the surprise almost every company discovers when it carries out its assessment. Most think building energy is the largest category. It depends on the sector, but this is rarely true. The largest category is scope 3, meaning everything outside the company's roof. Purchases. Freight. Travel. 88% of an average company's footprint is scope 3. And scope 3 is everything that does not happen within your walls but exists because of your activity.
Services (50 employees)
Typically 500 to 2,000 tCO2e per year. Scope 3 accounts for 80 to 90% of the total. Main categories: business travel + commuting (30 to 40% of the footprint), IT purchases and subcontracting (25 to 35%), office energy (10 to 15%). The distribution is highly asymmetric - three or four large IT orders and two or three executives driving many kilometres can account for half the footprint. This is where granular data change everything: once you know who does what, you can really prioritise. A concrete example in our guide for grandes écoles and universities.
Manufacturing (100 employees)
Typically 2,000 to 10,000 tCO2e per year. Scope 3 accounts for 70 to 85%. Categories: raw materials (40 to 60% of the total footprint), freight and logistics (10 to 15%), process energy (15 to 25%). A steel parts manufacturer? Raw materials dominate. A haulier or logistics provider? Freight accounts for most. A craft business doing assembly and subcontracting? Freight and purchases. A chemical manufacturer with energy-intensive processes? Process energy can rise to 40%. It differs greatly from sector to sector.
Hotels and catering
Typically 1,000 to 5,000 tCO2e per year depending on size and star rating. Leading categories: restaurant food (30 to 40%), energy (20 to 30%), linen and laundry (10%), customer travel (15 to 20%). What is interesting is that food dominates, so the opportunities are highly accessible - an attractive meat-free menu, local partnerships, portion matching to reduce waste. We have seen a hotel group reduce its scope 3 by 25% simply by changing its food sourcing. This is a real reason to act.
Healthcare and hospitals
Typically 10,000 to 50,000 tCO2e per year. Leading categories: medicines (30 to 40% of the footprint), medical devices (15 to 20%), building energy (15 to 20%), infectious healthcare waste (5 to 10%). It is counterintuitive, but what repeatedly emerges in engagements is that a hospital's largest emissions category is not its buildings, despite their enormous consumption; it is pharmacy. Medicines account for 30 to 40% of the average carbon footprint. This is because chemical synthesis and pharmaceutical distribution are highly carbon-intensive. This is why many hospitals are starting to work with laboratories to optimise packaging and transport, rather than reduce medicine consumption, of course. For a complete view of hospital opportunities, our university hospital climate strategy guide details the approach by establishment.
Plastic cups account for 0.01% of the footprint. The executive committee's 3 transatlantic flights account for 0.2 to 1%. The problem is never willingness - it is orders of magnitude.
2Transport, energy, food, digital
Let us turn to the figures that move the needle. Not those of CSR marketing - those from practice. In six years and more than 120 engagements, we see the same orders of magnitude repeat with surprising regularity. Here is what you need to keep in mind, because these are the only figures that really generate a strategic conversation when presented to the executive committee.
Carbon orders of magnitude
Logarithmic scale - Paris-New York contributes as much as 33 kg of beef
Transport: Paris-New York = 1 tonne, Paris-Marseille TGV = 3 kg
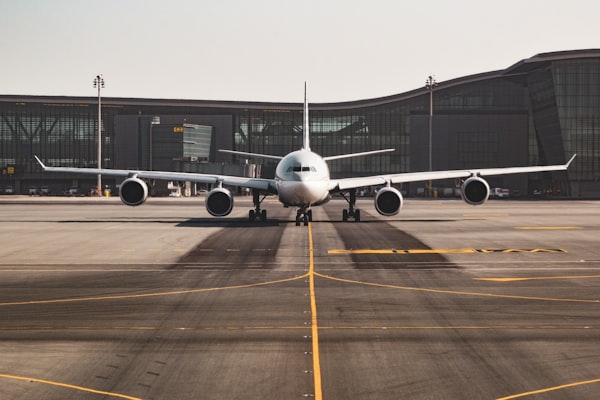
Transatlantic return flight (Paris-New York): 1 to 1.75 tonnes of CO2e. Remember, this is 11 to 19% of an average French person's annual footprint. Two intercontinental journeys per year and you have consumed 20% of your annual carbon budget on travel. This is why aviation is the most divisive subject in company carbon footprints: it concentrates a massive impact among very few people, generally the executive committee and key-account sales staff.
Paris-Barcelona return flight: 250 kg of CO2e. This is the easyJet weekend. It costs the price of a hotel night in an executive committee travel budget, for a quarter of a tonne of CO2e. And at this scale, if you make three or four a year, it starts contributing to the footprint.
Paris-Lyon TGV (500 km): 1.8 kg of CO2e per person. This is France's electric train with its almost decarbonised energy mix. It means you can make 140 train journeys before consuming the carbon equivalent of one Paris-Barcelona return flight - we explain why flying seems cheap in a dedicated article. This is not a question of sensitivity; it is a question of physics: planes burn kerosene, the TGV burns decarbonised electricity.
Combustion-engine car: 0.2 kg of CO2e per km. One-way Paris-Marseille by car: 800 km, meaning 160 kg. The same journey by plane: around 150 kg per passenger, including contrails. Alone at the wheel, a combustion-engine car therefore matches a plane, and moves clearly ahead with 2 or 3 people on board. Electric car in France: 0.05 kg of CO2e per km. Four times better than a combustion-engine car. This is why transitioning business vehicle fleets can generate reductions of 20-30% in a service-sector SME's climate footprint.
Energy: one year of gas heating = 2.5 tonnes, electric = 0.5 tonnes
Gas heating for a 100 m² house: 2.5 tonnes of CO2e per year. This is housing's largest emissions category. An electric heat pump supplied by France's grid reduces this figure to 0.5 tonnes - an improvement by a factor of 5. This is why the heat pump is the most important climate technology of the next 20 years. It is not sexy or visible, but it is the only option that divides the largest category in France's residential footprint by 5.
1 kWh of gas: 0.227 kg of CO2e. 1 kWh of electricity in France: 0.057 kg. A ratio of 4 to 1. 1 kWh of electricity in Germany: 0.385 kg. Poland: 0.773 kg. This shows why electrification in France is an enormous competitive advantage for decarbonisation - our electricity is 10 times less carbon-intensive than Poland's. If you have a factory in France with electric heating and a subsidiary in Poland with electric heating, France's footprint will be 6 to 7 times better. It is no coincidence that major French manufacturers are starting to prioritise electrification.
Food: 1 kg of beef = 30 kg CO2e, 1 kg of chicken = 5 kg
Beef: 30 kg of CO2e per kg of meat consumed. Chicken: 5 kg. Fish (average): 5 to 15 kg depending on species and fishing method. Local seasonal fruit and vegetables: 0.5 to 2 kg. Cheese: 7 to 10 kg. A factor of 60 between beef and lentils. This is the reality for almost every company we support with a staff restaurant: rather than eliminate meat, offer an attractive vegetarian option that moves 40-50% of staff to meat three days a week instead of five. For a workforce of 500, this represents 150 tonnes of annual reduction.
Digital: emails are zero, servers are another matter
An email: 0.004 kg of CO2e. Stopping 1,000 unnecessary emails per day would save 4 kg per day, around 1 tonne over the year, or 0.05 to 0.2% of a service-sector SME's footprint. This is the ultimate symbolic gesture - the one that eases your conscience and changes absolutely nothing in the orders of magnitude. 1 hour of HD streaming: 0.036 kg of CO2e. A few dozen hours of streaming are needed to match one hour of gas heating in a house.
But digital is not about use; it is about equipment. A new smartphone (manufacturing): 40 to 80 kg of CO2e. A cloud server (manufacturing + operation over 5 years): 600 to 1,000 kg of CO2e per year. This is 150,000 to 250,000 times more than an email. The real digital issue is equipment replacement: an SME replacing 20 computers a year rather than 10 adds 2 to 4 tCO2e every year, while it could keep the same hardware for two or three more years. Digital sufficiency matters, rather than sorting emails.
3A French person's footprint
Let us start with the basic reference point. An average French person emits 9 tonnes of CO2e per year. This covers all sources: housing, transport, food, consumption, public services. The figure comes from ADEME and has held for fifteen years, with variations by methodology. It captures the average reality, but the distribution is highly unequal - a Parisian executive does not inhabit the same world as a worker elsewhere in France.
Concrete equivalents to visualise what 1 tCO₂ represents
9 tonnes on average, but very unequally distributed
How are these 9 tonnes broken down? Transport: around 30%. This is the largest category and the most variable by profile - someone flying twice a year for work can easily double or triple this figure. Food: 22%. Housing: 23% - heating, electricity, hot water. Consumer goods: 17%. Public services and infrastructure: 8%. These proportions already let you make a quick calculation for your own situation. Do you fly once a month? You are probably between 12 and 15 tonnes. Do you heat with gas, eat plenty of red meat and have a conventional urban lifestyle? You are roughly average.
The 2-tonne target: what it means in practice
The Paris Agreement sets a clear target: limiting warming to 1.5°C implies a footprint per person of around 2 tonnes a year by 2050. We are currently at 9 tonnes. This means dividing by 4 or 5. Not a 10% reduction, not a 30% reduction. Dividing by 5. The IPCC has repeated this for two decades: it is a structural transformation, rather than an energy efficiency adjustment. What does this mean in practice? Zero transatlantic flights. Electric heating powered by renewables. A largely plant-based diet. No new combustion-engine car. This is not poverty, but it is the opposite of contemporary consumer life. And precisely because it is a radical transformation, companies that understand it gain a window of opportunity: those starting to adapt now will not be caught out by regulation in 2030.
4Misleading options
One category of action appears in almost every company climate plan: symbolic gestures. They are easy to implement, easy to communicate and create an impression of action. But measure them against the actual size of the footprint and they disappear.
Eliminating plastic cups from the canteen: 0.01% of the footprint. Switching off lights in the evening: 0.1 to 0.5%. Eliminating unnecessary emails: ~0%. Planting trees to offset: this is a conceptual scam - a tree neutralises its carbon dioxide in 30 to 50 years; you have 20 years to really decarbonise. These gestures are personally pleasing. But if you need to make 100 tonnes of reductions, these actions give you 0.01 to 1.
By contrast, here is what really contributes. Reducing the executive committee's transatlantic return flights from 3 per year to zero: 3 to 5 tCO2e, or 0.2 to 1% of the service-sector footprint, already dozens of times the effect of cups. Replacing 50% of virgin steel purchases with recycled steel: 20 to 30% of the industrial footprint. Electrifying 50% of the vehicle fleet: 5 to 10% of the logistics footprint. These are the actions that change the figures. The message: act on what contributes, rather than what is visible.
5How to use these reference points in your strategy
These orders of magnitude serve three specific purposes. First: prioritising the action plan. Focus your energy on the 3 to 5 categories exceeding 5% of the footprint. This means 5 reduction actions, rather than 20. Second: communicating with management. Concrete figures trigger action in the executive committee far more than abstract percentages. "We save 50 tonnes per year" does not get through. "We save the equivalent of 30 to 50 Paris-New York return journeys" triggers a real conversation. Third: avoiding unintentional greenwashing. Not investing €100,000 to reduce 1% of the footprint is stupid capital allocation, even if it sells well in internal communications.
Then comes what follows: the Bilan Carbone®. These orders of magnitude serve as a preliminary language, a shared culture. But to really know where you stand, you need to measure YOUR specific figures. A service-sector SME can be at 200 tonnes per year or 2,000, depending on whether it consists of developers working remotely or architects making two London return journeys per month. These reference points are the grammar. The assessment is the language.
6Key takeaways
Without orders of magnitude, organisations act on what is visible (cups, emails) rather than what contributes (flights, purchases, heating). These reference points do not replace a carbon footprint - but they help distinguish noise from signal.
- Three figures to remember: a transatlantic return flight = 1 tonne of CO₂, one year of gas heating (100 m²) = 2.5 tonnes, scope 3 = 88% of an average company's footprint
- Misleading options: eliminating plastic cups = 0.01% of the footprint, switching off lights = 0.1-0.5%, sorting emails ≈ 0%. These gestures are not pointless - they are simply microscopic
- The real opportunities: replacing 50% of virgin steel with recycled steel = 20-30% of the industrial footprint. Eliminating 3 executive committee transatlantic flights = 0.2 to 1% of the service-sector footprint, already dozens of times the effect of cups
- Food surprises: beef emits 60 times more than lentils per kilo. In collective catering, this is the category where one purchasing decision changes the footprint by 20-25%
- France's electricity mix is an advantage: 0.057 kgCO₂/kWh versus 0.385 in Germany. Electrifying a use in France divides its footprint by 4 to 7
7Frequently asked questions
Where do these figures come from?
ADEME's Base Empreinte (March 2025 update, FIGARO 2018 MRIO model). Our own field engagements (120+ since 2019), which validate these orders of magnitude project after project. The Shift Project's reports on economic decarbonisation. Haut Conseil pour le Climat on reduction pathways. When I quote a figure such as "0.227 kg of CO2e per kWh of gas", it is not rounded - it is what comes from the ADEME database we use in every assessment. There is variance of ±10-15% depending on sources and methodologies, but the order of magnitude does not change.
Is my company above or below average?
Impossible to say without an assessment. These reference points give very broad ranges because two SMEs in the same sector can have completely different emissions profiles. The one with three employees consulting from a café? 150 tonnes. The one with a small factory? 5,000 tonnes. Orders of magnitude give you a common language. You find your own figure in a Bilan Carbone®.
Is the digital footprint really negligible?
Use, yes (emails, streaming): grams per day. Equipment, no. A data centre can emit 1,000 to 5,000 tCO2e per year. If your SME hosts its data in the cloud, you have a share of this footprint. It gradually adds up. 50 laptops replaced every 3 years rather than 4? Around 1 additional tCO2e per year, equivalent to 250,000 emails. This is the real digital issue. To explore it, you will find more detail in our dedicated digital footprint article.