
- 116 European PEF categories plus 2 French complements make up the score: a multi-criteria view, not only carbon.
- 2The durability coefficient runs from 0.67 to 1.45, penalising fast fashion and rewarding repair.
- 380% of the work is supplier data. The calculation itself takes a few minutes.
- 4Since October 2026, a third party can publish your score: that includes an NGO or a competitor, if you have not already done so.
Made in France by an "ethical" brand, a 150 g organic cotton T-shirt scores 386 impact points. An ultra-fast fashion polyester T-shirt made in Asia scores 1,010 points. That is a ratio of 1 to 2.6 for the same type of product, according to the examples published by the French Ministry of Ecological Transition. This gap is what the environmental cost (the French eco-score) makes visible, and since 1 October 2026 any third party can publish yours if you have not done so.
The official label, decoded
What a brand has been able to display voluntarily since October 2025.
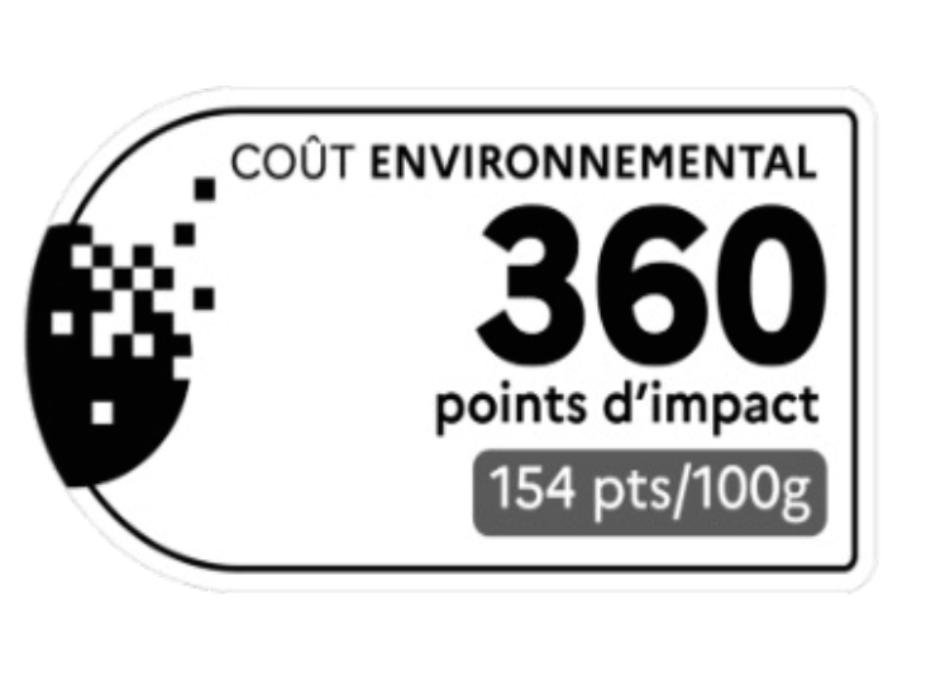
- "Environmental cost"
Official term (2025 decree). Aggregates 16 Product Environmental Footprint (PEF) categories and 2 complements, not only carbon.
- 360 impact points
Absolute score with no cap. The lower the score, the better. The ministry's examples for a 150 g T-shirt range from 386 to 1,010 pts.
- 154 pts / 100 g
Score scaled to weight. Lets you compare a T-shirt with a coat.
We have supported textile brands with their life cycle assessments (LCAs) (in French) for three years. This guide sets out how the scheme works in France in 2026.
1How the score is calculated: a multi-criteria total divided by a durability coefficient
Textile environmental labelling in France takes the form of a single score that sums up a garment's impact over its whole life cycle, from the extraction of the fibre to the end of the product's life. The score is expressed in "impact points": the higher the number, the greater the impact. Unlike the Nutri-Score food label, it has no letter or colour. It is an uncapped number of points, shown as such alongside the same figure scaled to 100 g.
Contrary to what you might expect, it is not a carbon score. It aggregates the 16 impact categories of the Product Environmental Footprint (PEF) method (climate, water, land, ecotoxicity, resources and so on) and adds 2 complements: microfibre release and export outside Europe. This multi-criteria view goes well beyond CO2 alone. Garments are compared within 11 product categories (T-shirts, jeans, shirts, jumpers, jackets and so on), which avoids comparing a swimsuit with a winter coat.
The wide gap: from 386 to 1,010 points for a T-shirt
Environmental score in impact points - the lower, the better.
Fashion type: "ethical" · 150 g
Fashion type: "traditional" · 150 g
Fashion type: "ultra fast fashion" · 150 g
Organic cotton on one side, polyester on the other.
France or Turkey versus Asia: electricity mix and transport.
Durability coefficient, from 1.45 (best case) to 0.67 (worst case), which divides the score.
16 European PEF indicators + 2 French criteria
The methodological foundation is the PEF, the European life cycle assessment (in French) method. It rests on 16 indicators: climate change, water use, ozone depletion, acidification, eutrophication (freshwater, marine, terrestrial), depletion of fossil and mineral resources, photochemical ozone formation, particulate matter, human toxicity (cancer and non-cancer), aquatic ecotoxicity and land use. The Ecobalyse calculation tool applies adapted Environmental Footprint (EF) 3.1 factors to inventories that are mostly ecoinvent 3.9.1, published in the Base Empreinte database of ADEME (the French Agency for Ecological Transition). The regulatory version remains v7.0.0 of 29 July 2025, regardless of the switch to new LCA databases (in French) under way at European level.
The final score formula
Move the coefficient: for the same footprint, the displayed score is divided by a coefficient that depends on the brand model.
France judged these 16 indicators insufficient for textiles and added two: the release of plastic microfibres during washing, a major issue for synthetic fibres that the European PEF did not cover, and the export of textile waste outside Europe, a criterion that penalises models in which "recycling" means shipping bales of used clothing to Africa or Asia.
The 16 categories are weighted (human toxicity categories set to zero, ecotoxicity given extra weight) and then aggregated, and the 2 complements are added in impact points. This total is then divided by a durability coefficient (between 0.67 and 1.45) that penalises very wide product ranges and low prices relative to the cost of repair. The calculation tool is Ecobalyse, an open-source calculator developed by the Ministry of Ecological Transition and ADEME. It is free and available to all brands.
The durability coefficient, the divisor of the score
This is arguably the most interesting, and the most controversial, element of the French method. The durability coefficient is a divisor applied to the raw LCA score, ranging from 0.67 to 1.45: the higher it is, the lower the score. It does not measure how well the fabric resists tearing; it assesses two parameters tied to the brand's business model.
Why a T-shirt can show two different scores
With the same footprint, the final score is divided by the durability coefficient: it varies by a factor of two.
- Range width: the maximum number of new product references offered on the same day in a segment (women, men, children and so on). Above 1,000, the index falls, and it reaches zero beyond 16,000. The wider the range, the lower the coefficient and the more heavily the final score is penalised.
- Incentive to repair: the fixed repair cost (€10 for a T-shirt, €14 for a pair of trousers) set against the price incl. VAT, excluding promotions. For companies that are not small and medium-sized enterprises (SMEs), a repair service labelled by Refashion (the producer responsibility organisation for textiles, household linen and footwear) accounts for a third of this index.
In practice, the same pair of jeans gets a lower score from a brand with a narrow range that sells it at a high price relative to its fixed repair cost, because the incentive to repair accounts for half of the coefficient. Such differences stand out when scores are displayed side by side in store.
2Who is covered: every brand selling clothing in France, in two phases
The regulatory framework took five years to build, from France's Climate and Resilience Act of 2021 to Decree No. 2025-957 of 6 September 2025 (the Légifrance pages are in French). Textiles are the first sector to have a complete operational framework. Two phases need to be kept apart.
From principle to opening up to third parties
Textiles are the first sector with a regulatory framework for environmental labelling, which remains voluntary.
Climate and Resilience Act
Ecobalyse pilot
Notification to the European Commission
Decree No. 2025-957
Phase 1 - voluntary labelling
Phase 2 - third-party publication without consent
Since October 2025: voluntary display
Since 1 October 2025, brands have been able to display the environmental score of their products on their e-commerce site and in store. The framework is in place, the tool is available and the methodology is stable. One point deserves attention: a brand that already communicates its own in-house "sustainability score" may keep it, but it must also display the official environmental cost, without contradiction, and this has applied in full since 1 October 2026.
October 2026: anyone can publish your score instead of you
This mechanism strengthens the case for publishing without making display mandatory. Since 1 October 2026, any third party can calculate and publish a brand's score without asking for its consent. That includes non-governmental organisations (NGOs), consumer associations, competitors and comparison platforms. The calculation uses available or estimated data, with conservative default values for the optional parameters.
The scheme covers all brands that sell textile clothing products on the French market, whatever their size or country of manufacture. A T-shirt made in Bangladesh and sold on a French online shop is subject to the same framework as one made in Brittany.
Textile environmental labelling remains voluntary, but since 1 October 2026 a third party can publish the score of a brand that has not done so itself.
3The spread between brands, from 1 to 2.6, and how to lower your score
The examples published by the Ministry of Ecological Transition were calculated with Ecobalyse for the simplest product to compare: a 150 g T-shirt.
- Organic cotton T-shirt, made in France, "ethical" fashion: 386 impact points
- Cotton T-shirt, made in Turkey, "traditional" fashion: 679 impact points
- Polyester T-shirt, made in Asia, "ultra-fast fashion": 1,010 impact points
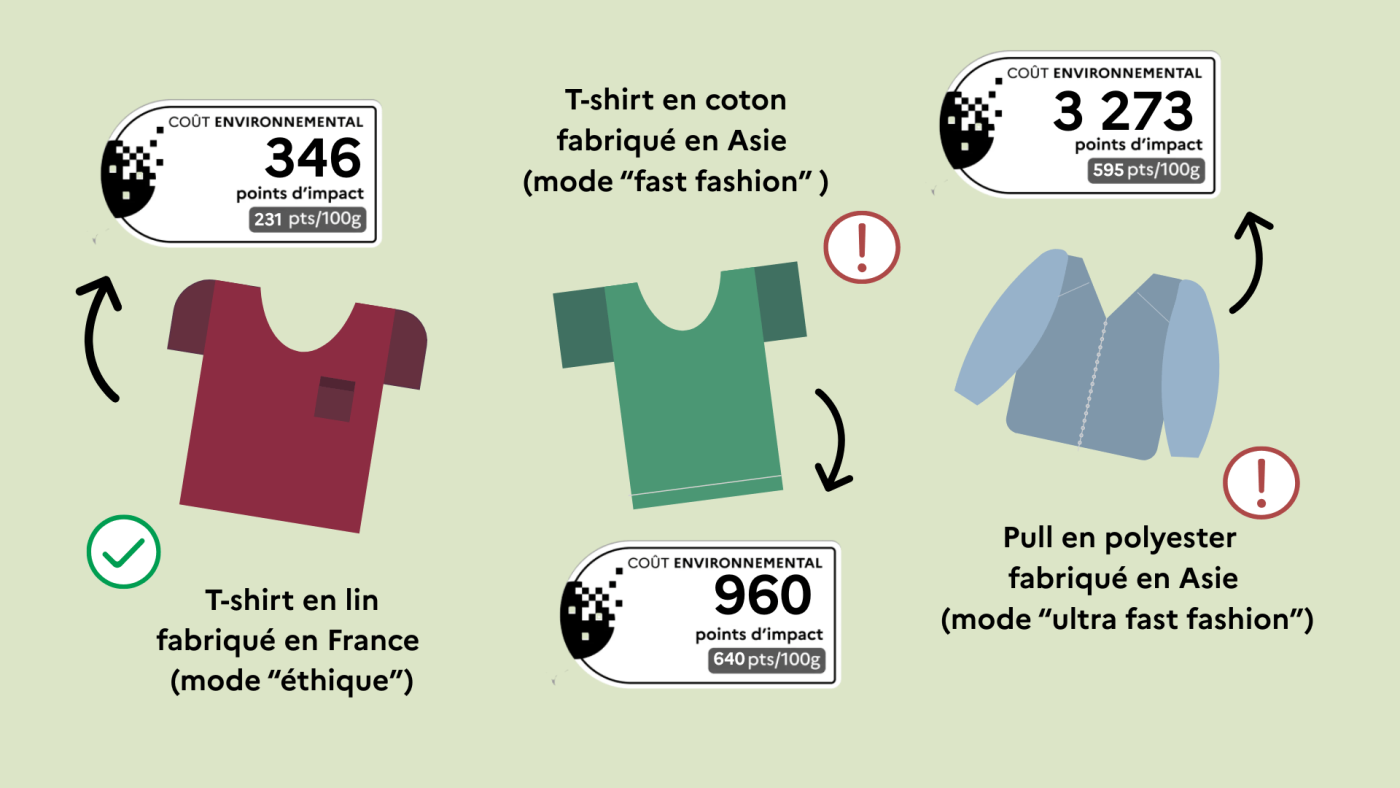
That is a ratio of 1 to 2.6 for the same type of product. The gap comes from 3 combined factors: the material (organic cotton on one side, polyester on the other), the location of production (energy mix, transport distance) and the durability coefficient (covered above).
The score makes visible design choices that used to be invisible to the consumer. Switching from virgin to recycled polyester lowers the score; so does moving dyeing closer to where the garment is made, or pricing a garment in line with its repair cost. Each of these decisions has a quantifiable effect, and that is the real change: eco-design (in French) stops being a brochure argument and becomes a product management tool.
A ratio of 1 to 2.6 between an organic cotton T-shirt made in France and an ultra-fast fashion T-shirt: the score reveals what the price concealed.
Once the score has been calculated, the question is where to start in order to lower it. Our three years of supporting textile brands point to a fairly stable framework: five known levers, with their orders of magnitude.
Raw materials: the stage that moves the score most. On a cotton T-shirt, switching from conventional cotton to organic rain-fed cotton reduces the material impact by 25 to 40% (less irrigation, no chemical inputs). French flax or hemp do better still on water (-50%). Post-consumer recycled polyester cuts the material impact of virgin polyester by a factor of two to three.
Location and energy mix. For the same material, the country of spinning and dyeing weighs heavily because these are the most energy-intensive stages. Dyeing in France or Portugal (low-carbon electricity mix) emits 30 to 50% less than in China or Bangladesh. Transport plays a marginal role (-2 to 5%), but air freight on urgent restocking multiplies the transport impact by 50 compared with sea freight.
Where does a T-shirt's impact come from?
Click on a stage to see what weighs most, and the associated lever. Conventional cotton, illustrative percentages.
Irrigation water, chemical inputs, low yield per hectare.
Organic rain-fed cotton or French flax −25 to −40%
Processes and consumption of water and energy. In dyeing, switching to pigment dyeing can reduce actual water consumption, but this choice is not a parameter of the official calculation. Fewer colourways mean fewer dye baths in practice. In garment making, optimising pattern making reduces actual offcuts, with no effect on the displayed cost, which applies a fixed loss rate.
Business model: range width and repair. This is the fastest lever because it does not depend on suppliers. A price in line with the repair cost and, for companies that are not SMEs, a repair service labelled by Refashion raise the durability coefficient and therefore lower the final score of the whole range (see above). Reducing the number of product references offered at the same time in a segment also raises it.
Use phase: a stage fixed by the method. In the official calculation, days of use and number of washes are set by category (45 and 45 for a T-shirt, 70 and 23 for jeans), then adjusted by the durability coefficient. Washing temperature and physical durability (quality of stitching, long warranty) are not taken into account in the regulatory version. They are genuine eco-design levers, with no effect on the displayed cost.
4Getting started: supplier data, publication steps, pitfalls and limits
The calculation method is settled, the levers are identified and the timetable is known. What remains is the longest and most political part of the project: getting supplier data, structuring the sequence, anticipating the pitfalls and knowing where to stop. To publish a solid score before a third party does it for you, there are 4 topics to work through.
The data to collect, supplier by supplier. The main obstacle to display is neither methodological nor financial: the method exists and the tool is free. It is logistical: you need data on every stage of the garment's life cycle, and collecting it is the hard part.
- Fibre: type (cotton, polyester, flax), geographical origin, farming method (organic or conventional)
- Spinning and weaving: country of spinning (optional) and of weaving or knitting (required)
- Dyeing and finishing: country (required), printing, fading treatments
- Garment making: country (required), share of air freight
- Business model: number of product references, price, company size, repair service
- Use and end of life: set by the method for each category
We support textile brands with their LCAs (in French). The moment of truth comes when we ask "where does your cotton come from?" The usual answer is "from our Turkish supplier", and the next question, where the cotton came from before Turkey, is met with silence. Textile supply chains often have five to eight intermediaries between the fibre and the finished garment. At each link some information is lost, and every gap in the data comes back as impact points.
Budget, lead time, tools and deadline depending on your profile
Three typical Celsius profiles, orders of magnitude observed on textile engagements in 2024-2026. Environmental labelling itself, however, remains voluntary.
Actual data versus default values: the gap that costs you. The methodology provides default values for several optional parameters. Some are conservative: an unknown country of spinning, 100,000 product references or a share of air freight. The main parameters (materials, and the countries of weaving, finishing and garment making) have no default value and must be provided.
The paradox is striking: the stages that weigh most in the score (fibre, spinning) are those where data is most often missing, while the stages that brands control best (garment making, transport) weigh the least. Brands that document their supply chain replace these conservative values and often achieve better scores, which is a direct competitive advantage, visible in store.
A sequence of 4 steps to publish your scores. The timetable is set: from 1 October 2026, third parties can publish your scores in your place. Here is the sequence in practice, starting from scratch.
- Pilot LCA on one representative product: choose a flagship product (T-shirt, jeans, jumper) and carry out an LCA (in French) with a specialist firm. Budget: €8,000 to €15,000 (in French) before any subsidy. The Diag Éco-conception (eco-design diagnostic) run by Bpifrance, the French public investment bank, is a fixed 18-day package that includes an LCA. The out-of-pocket cost is €5,400 excl. VAT for companies with fewer than 50 employees and €7,200 excl. VAT for those with fewer than 250. See all available funding schemes (in French) (in French).
- Map the supply chain: identify, supplier by supplier, the data available (energy mix, fibre origin, chemical treatments, transport modes). For the optional parameters, each gap is filled by a conservative default value.
- Calculate the scores on Ecobalyse: the tool is free and open source. Enter the data product by product, identify the improvement levers and iterate.
- Submit, then publish: file each calculation on the official portal, then display the cost with the regulatory signage on your website and in store. A score calculated with your own data, even imperfect, is better than one published by a third party using default values.
Five classic pitfalls at the start of a project
On the textile LCA projects we have carried out over the past three years, the same five mistakes come up at the start every time. None is fatal, but each costs time and score points.
- Believing that Ecobalyse alone is enough. The tool is free, but without actual supplier data it falls back on conservative default values for the optional parameters. The resulting score is often higher than the real one, and it is the one a third party can publish.
- Trying to calculate everything at once. Starting with the whole catalogue guarantees that the project will stall. Start with one pilot product, stabilise the method, then scale up. Allow 8 to 10 weeks for the pilot.
- Forgetting tier 2 and tier 3 suppliers. There are five to eight intermediaries between the fibre and the garment. Stopping at tier 1 leaves the heaviest stages (fibre, spinning) on default values.
- Underestimating the time needed for data collection. Allow 5 to 6 months between sending out the questionnaires and consolidating the answers. Starting in January to publish in October 2026 was comfortable, and starting in June was already tight.
- Communicating before the calculation is stable. Seeing your score drop by 15% two months later looks amateurish. It is better to freeze the score by quarter, update it at most once a quarter, and do so within 12 months of any change to the regulatory method.
What the score does not measure
We have supported manufacturers on textile LCAs (in French) for years. To be plain about it, the French method is ambitious and, on the whole, well designed. It also has limits, which are worth understanding so that you do not promise the wrong thing.
- The social dimension is absent: the score measures environmental impact, not working conditions. A T-shirt sewn in an unhealthy workshop can still score very well if the materials are good.
- Microplastics are only partly covered: adding microfibre release is progress, but only washing is covered (not production or end of life). The impact of polyester remains underestimated.
- Production volume is not measured: the coefficient captures range width, not the volume produced. A narrow range with millions of units per product reference is not penalised.
- The fit between the French and European systems is still unclear: France has added two criteria and a coefficient that the EU does not yet have. Brands operating across the EU may have to manage two systems during a transition period.
Despite these limits, the method remains the most comprehensive in the world for textiles, and above all it exists: the framework is in place, the tool is online and the deadlines are known. Waiting for a perfect scheme means risking a score calculated by a third party on the worst assumptions.
5Key takeaways
Textile environmental labelling is no longer a distant prospect: the decree has been published, Ecobalyse is online, and third parties have been able to publish a brand's score without its consent since 1 October 2026. Brands that take it up now turn a regulatory constraint into a competitive advantage, whereas those that wait will end up with a score calculated by others on the most penalising assumptions.
- The score aggregates 16 PEF categories and 2 complements, not only carbon. It is the most comprehensive multi-criteria view available.
- The durability coefficient penalises fast fashion and rewards repair. It ranges from 0.67 to 1.45, and as a divisor it changes the whole score.
- The real bottleneck is supplier data, not the calculation. The more default values you replace with actual data, the better your score.
- A single data collection effort serves three purposes: voluntary environmental labelling, the DPP (2028-2029) and CSRD reporting.
- Budget for a first textile LCA: €8,000 to €15,000. Bpifrance's Diag Éco-conception leaves an out-of-pocket cost of €5,400 to €7,200 excl. VAT.
Start with a pilot product, map your supply chain and publish your scores. Everything is already in place: you only need to start.