
- 1Nights above 20 °C rise from 2 to 9 a year at +2 °C
- 2Soils do not dry out: the risk comes from rainfall and runoff
- 3More than one Belgian in three lives in a municipality flagged for at least one risk
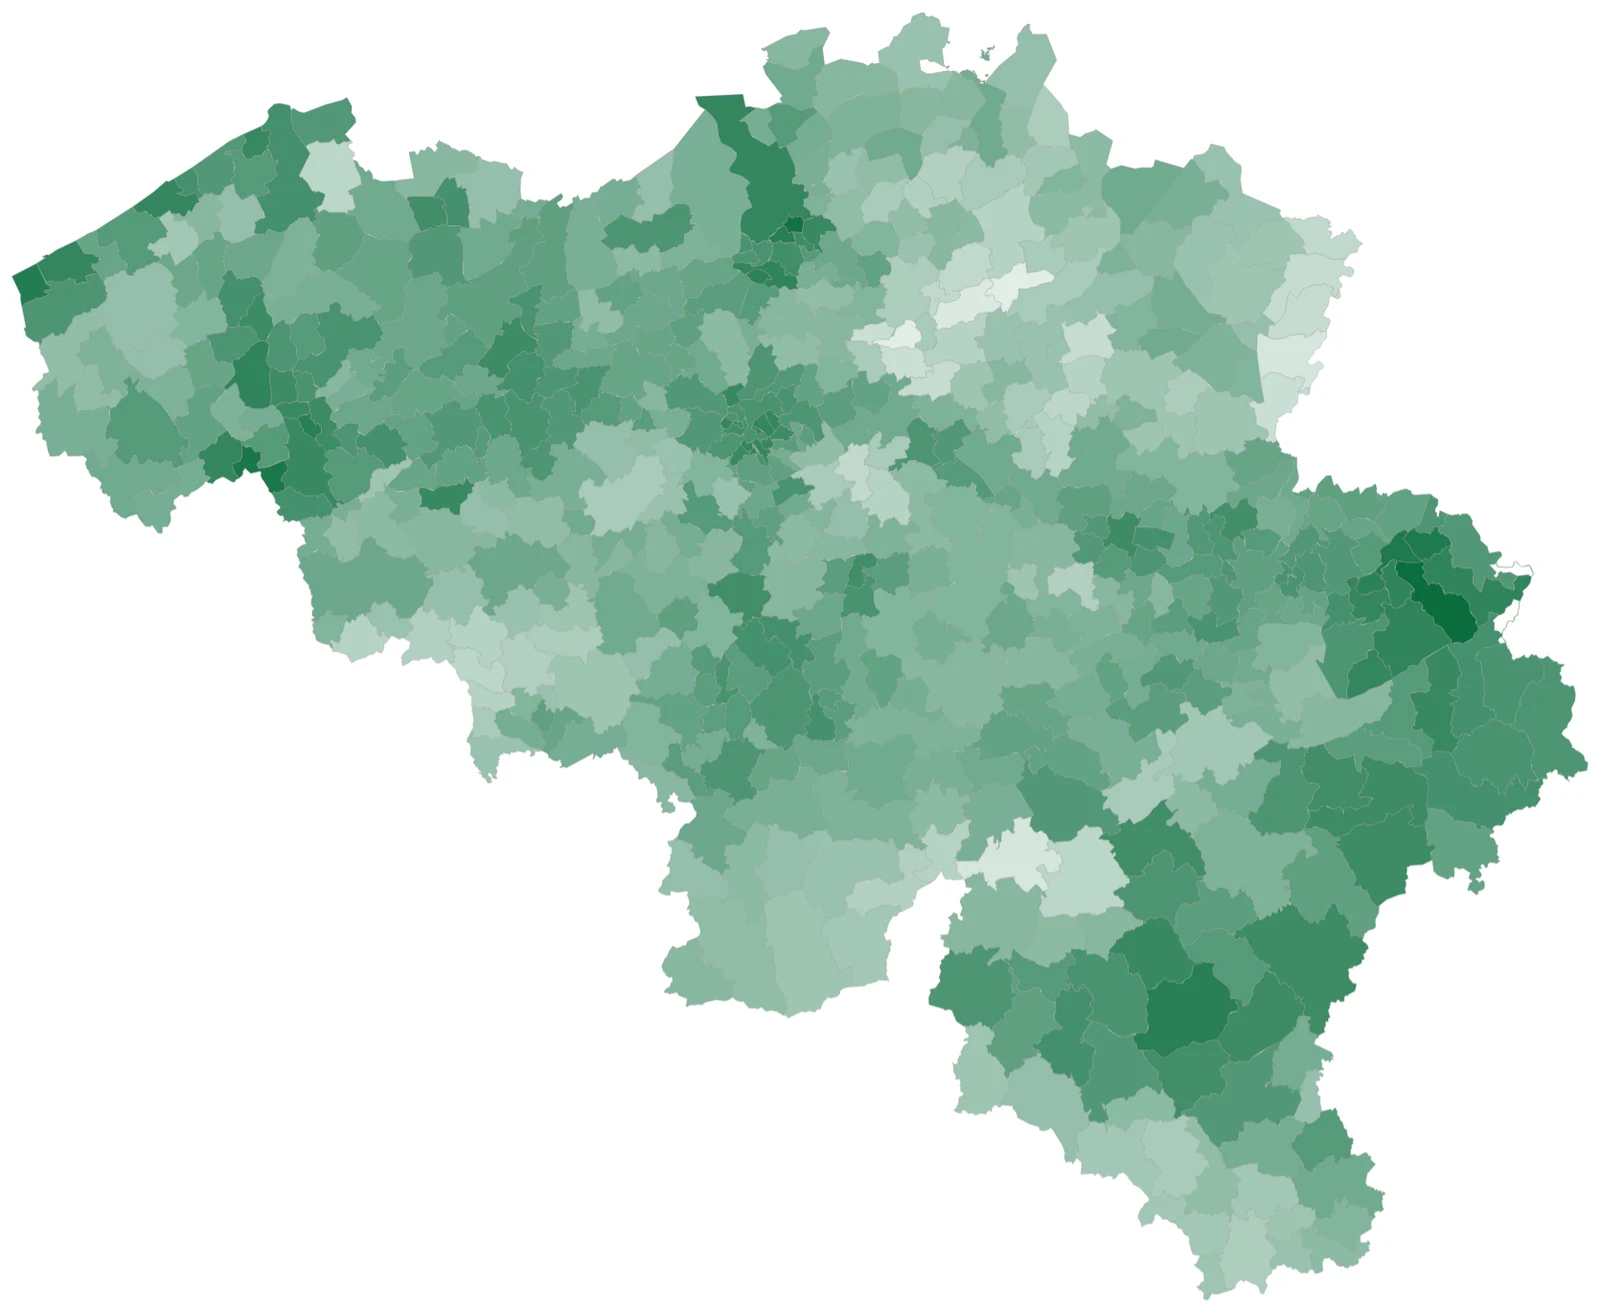
Five selectable risk categories, a liveability score for each municipality and indicator-by-indicator detail.
1+2 °C: a warming level rather than a date
Climate projections for Belgium exist, but remain scattered across indicators, regions and models. We have built the same tool for the country as for our map of France in 2050: a freely accessible map that brings these data together municipality by municipality and makes them readable at a glance.
The map describes a world warmed by 2 °C compared with the late nineteenth century, as a global average. Depending on the climate models, this level is reached between the early 2030s and the early 2060s. Rather than choosing a year, we have used the warming level itself, which is the common reference point across all models.
The six models do not always agree on the scale of changes, but they identify the same municipalities as the most exposed. This is why the map ranks municipalities relative to one another rather than announcing precise values for each.
2Heat, water, flooding, coast, services: the 5 risk categories
We have selected five categories: heat, water in soils, flooding, the coast and service deserts. Each can be viewed on the profile of each municipality.
Heat: nights that no longer cool down
The average temperature of the median Belgian municipality rises from 10.5 to 11.8 °C, and summer warms more than the rest of the year, by 1.8 °C. The most marked change affects nights: those that do not fall below 20 °C rise from 2 to 9 a year, while days above 30 °C slightly more than double.
For buildings, these nights matter. Night is when a home or office releases heat accumulated during the day, and a building that no longer cools down becomes difficult to live in without air conditioning. Passive cooling solutions are sized for these warm nights.
Water: a country that does not dry out
The models do not show summer drought in Belgium: summer soil moisture falls by only 1%, and annual rainfall even increases by 8%.
An adaptation plan focused on water shortages would therefore miss the main issue. In Belgium, the challenge is managing abundant rainfall, and the approach to adapting an area starts with this assessment.
Heat quadruples, drought does not change
Medians of the 565 Belgian municipalities. Each segment starts at today's value and ends at that of a +2 °C world, on an axis marked in multiples of the starting value.
Summer soil moisture loses one hundredth while warm nights quadruple. In these six models, +2 °C Belgium is not a country that dries out: it is a country that is much hotter and receives more water, more intensely.
Flooding: more water, in more intense events
Runoff over three days of heavy rainfall increases by 23%. We combine it with the flood hazard mapped by the three regions, which describes areas already known to be flood-prone.
The three regions do not draw these areas in the same way: for the same hundred-year flood, their extents vary by a ratio of 1 to 7. To prevent a municipality changing category when moving from one region to another, the map uses the highest hazard class, on which the three regions are comparable.
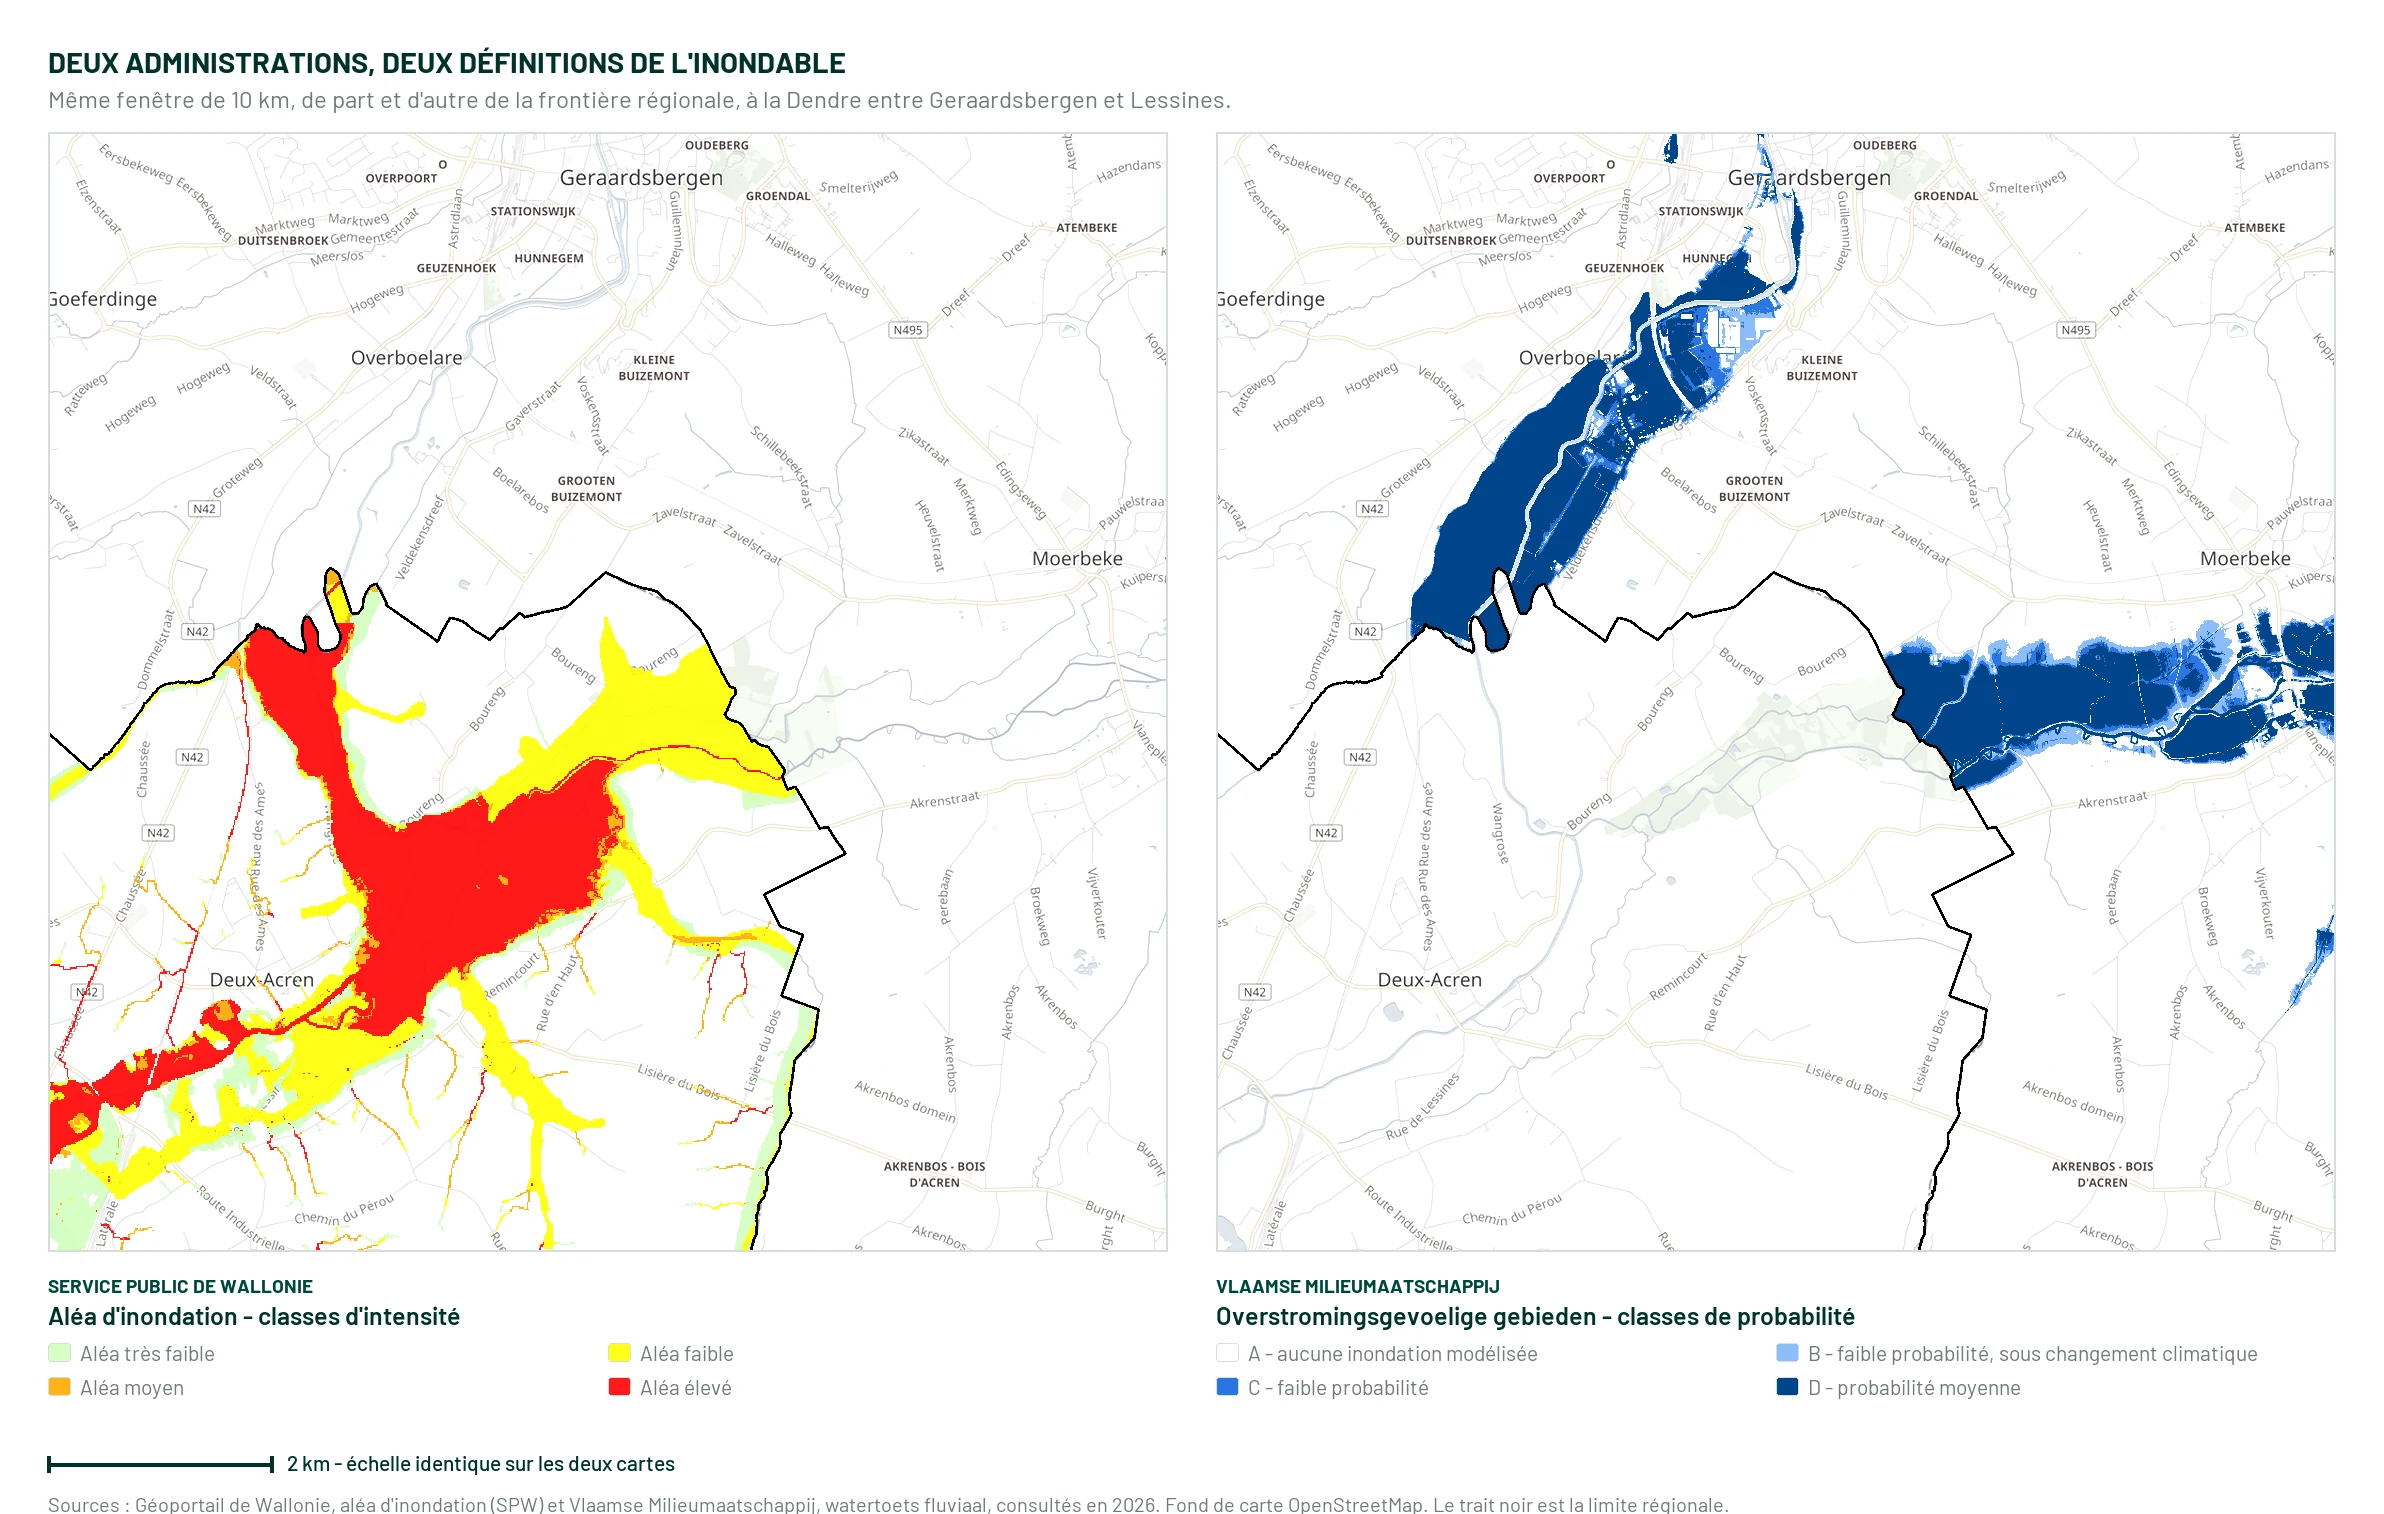
Flanders publishes probability classes, Wallonia intensity classes. For the nominal hundred-year flood, the three Belgian regions map extents in a ratio of 1 to 7. They do agree on severity, however, and the score uses the highest hazard class.
The coast: 17 municipalities affected
On the coast, the risk is coastal flooding, when a storm coincides with a high tide. It affects 17 municipalities, those with part of their territory in the coastal flood zones mapped by Flanders.
These municipalities are protected by dykes and dunes, so the maps show few flood-prone areas for frequent floods. The map therefore uses the complete coastal flood zone, that of a rare storm, which covers 70% of Middelkerke’s territory.
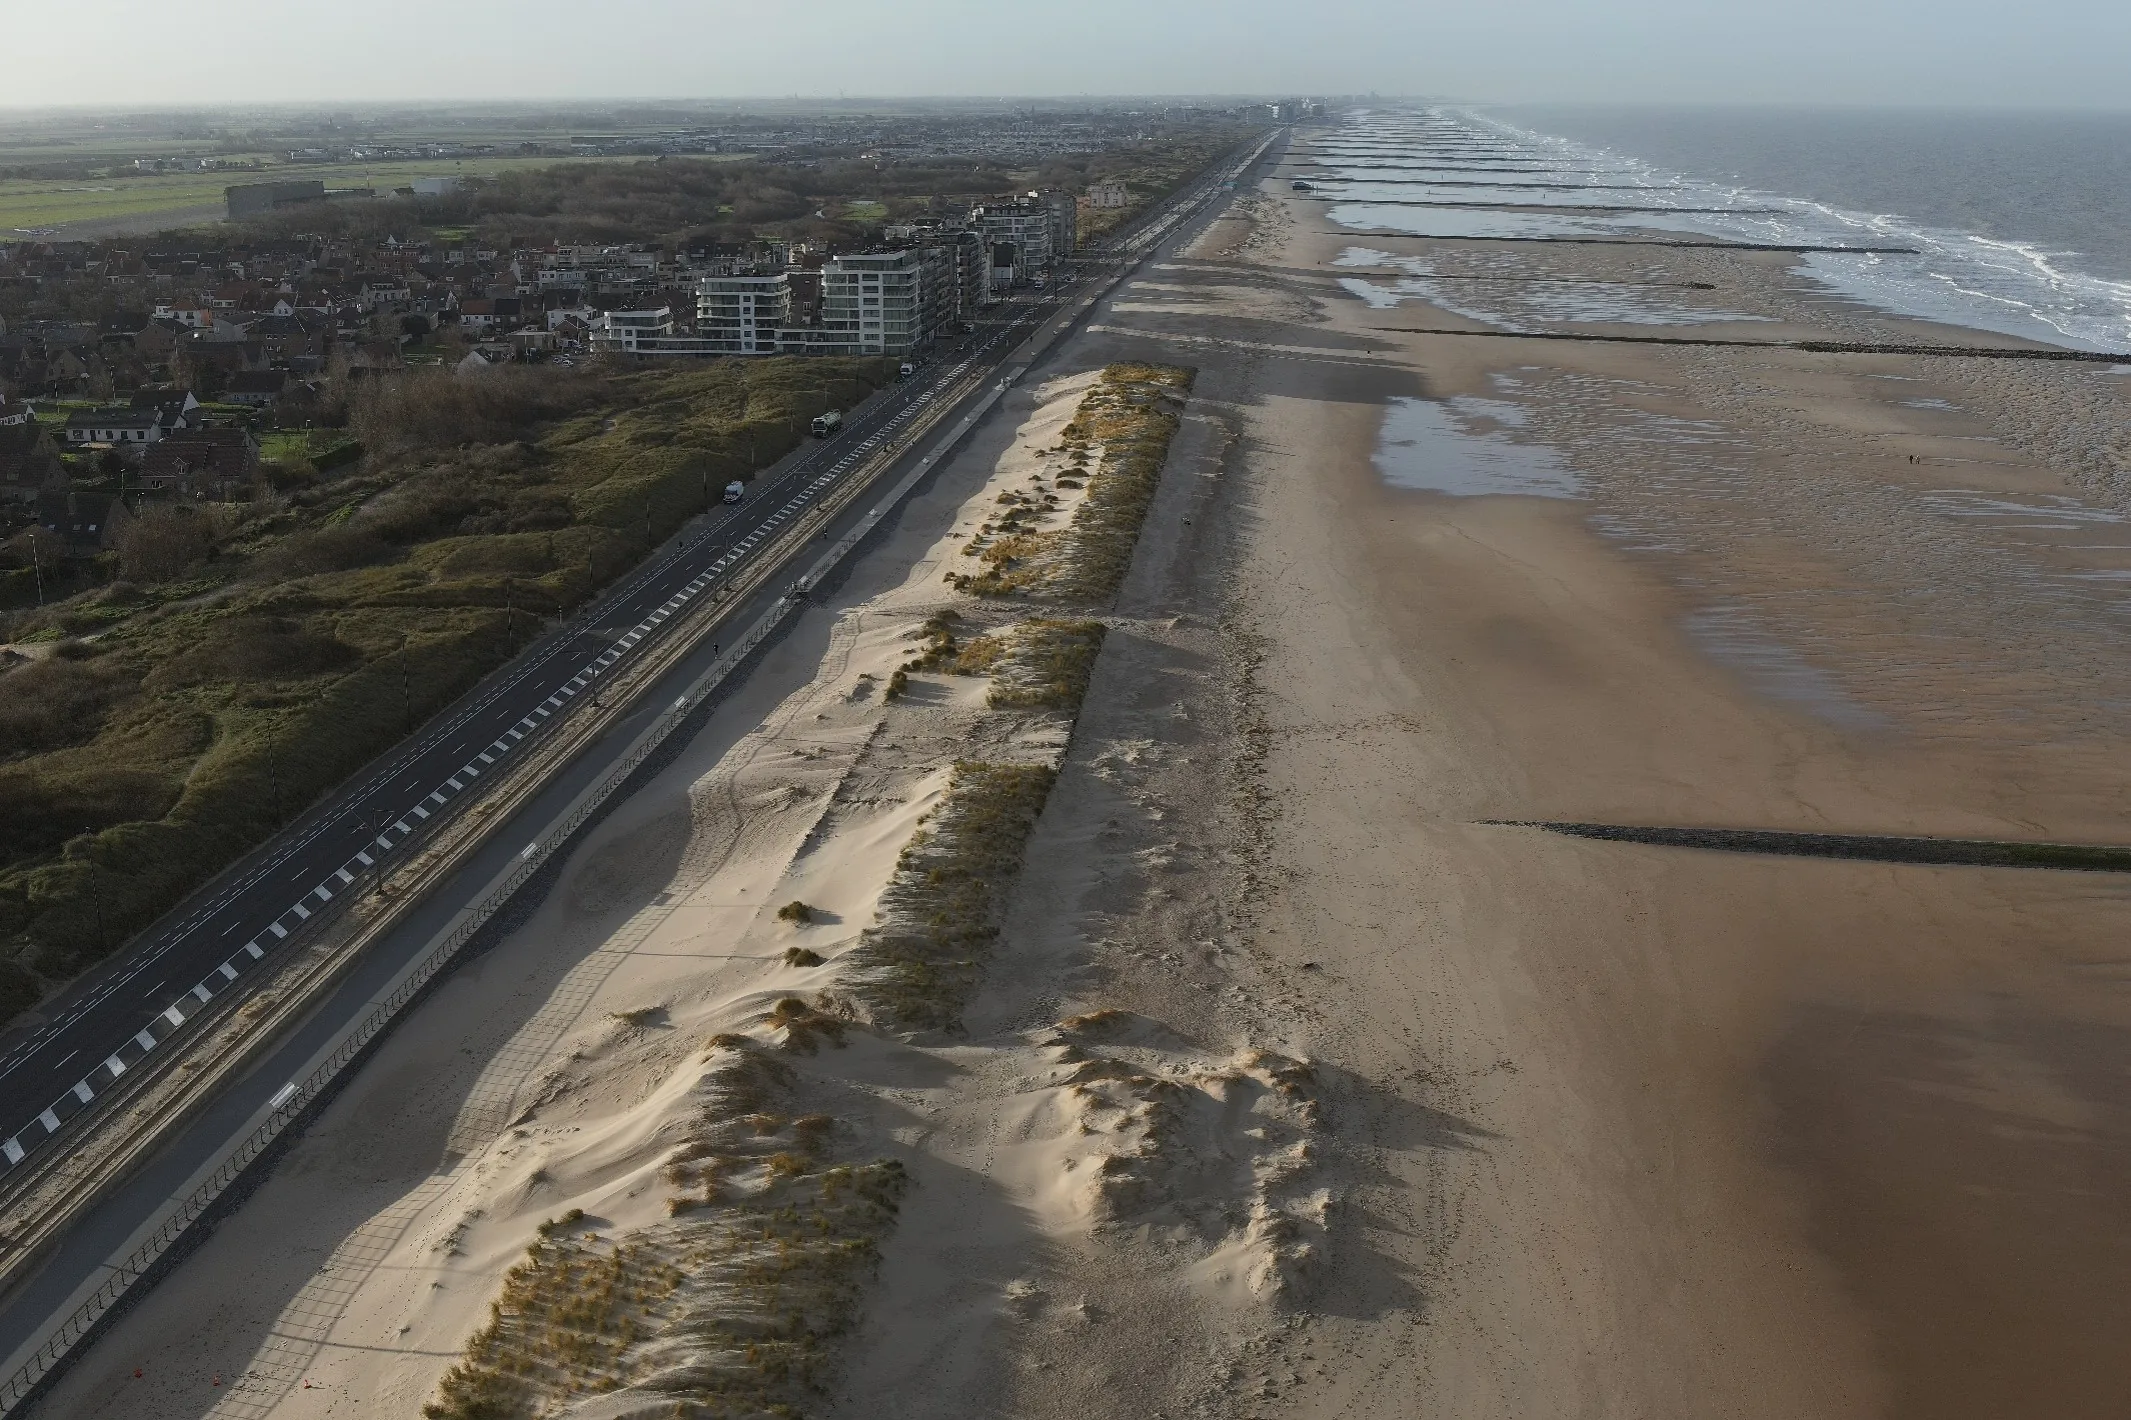
A coast protected by dykes experiences little frequent flooding: this is the intended effect of dykes, dunes and beach nourishment. Its risk lies in the rare event, which covers 70% of Middelkerke’s territory. The map uses this complete extent.
Service deserts
Living somewhere also means being able to receive healthcare and travel. This category measures the share of the population living within reach of a hospital, railway station and public transport stop, using Statbel data. It contributes to the score because an exposed and isolated municipality adapts with greater difficulty than an exposed and well-equipped municipality.
Hospital access clearly separates municipalities: one Belgian municipality in ten has almost no residents within 10 kilometres of a hospital. It is also the map’s most debatable criterion, because it measures distances rather than travel times and ignores provision in neighbouring municipalities.
3How the five categories combine
Each category is converted into a rank: a municipality receives a position among the 565 Belgian municipalities rather than an absolute mark. The five categories are then averaged with equal weighting, and the liveability score is 100 minus this average. The median municipality scores 50, and scores range from 27 to 74.
An average softens an extreme risk when the other categories are favourable. To avoid hiding it, each municipality’s profile separately flags the categories for which it is among Belgium’s 10% most exposed.
6 municipalities in 10 have no flags. Just over one in three has one, and barely one in twenty-five has two or more. Overall, more than one Belgian in three lives in a municipality flagged for at least one risk.
Conversely, Laakdal and Tremelo come at the bottom of the ranking with no flags: they combine marked heat, some of the country’s driest summer soils and limited access to services, without being at the extreme on any of these points. The score reflects this accumulation; the flags reflect the extremes.
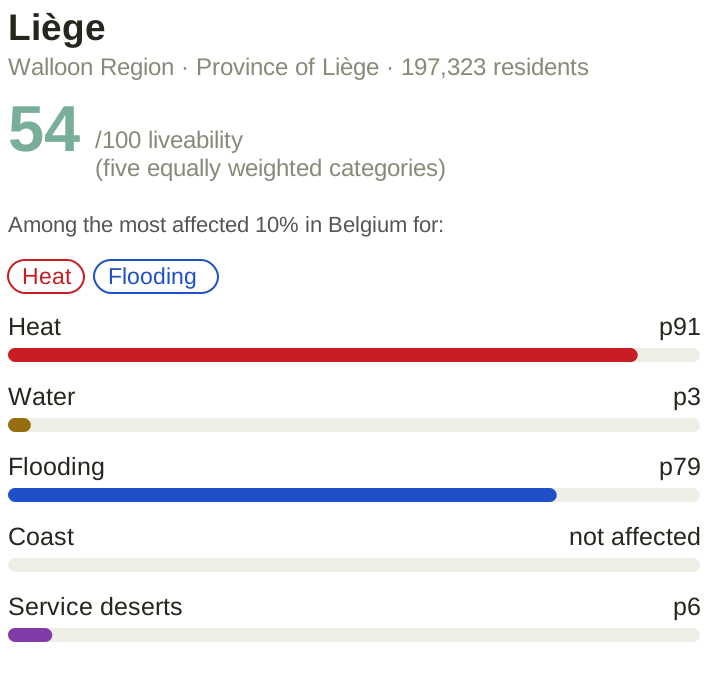
The major cities, meanwhile, rank relatively well. Antwerp, Brussels, Charleroi, Ghent and Liège all rank above the median, so the 20% lowest-ranked municipalities are home to only 15% of Belgians. Liège is nevertheless flagged for heat and flooding, but its access to services and well-watered soils compensate.
4The map’s limitations
It does not tell you where you should go. An exposed municipality that plants trees, removes sealed surfaces and adapts its buildings will be more liveable than a less exposed municipality that has done nothing. Adaptation does not enter any of our indicators, for lack of national data measuring it.
Nor does it tell you what happens within a municipality. The flood-prone valley floor and the plateau above it receive the same colour.
Finally, these are projections based on six climate models and a given warming level. For a company, the map indicates where to start a site assessment, within the framework set by the national adaptation plan on the French side, and funding is available to finance it.
- Xavier Fettweis, University of Liège · MAR v3.14 regional model on the RMI 5 km grid, six CMIP6 models ↗
- Royal Meteorological Institute of Belgium · Municipal climate profiles 1991-2020 ↗
- Statbel · Population near facilities, population structure ↗
- Wallonia Geoportal, Vlaamse Milieumaatschappij, Brussels Environment · Flood hazard in the three regions ↗