
- 1Digital technology accounts for 4.4% of France's carbon footprint and 11% of its electricity (2022).
- 2In France, devices account for 50% of the digital carbon footprint, data centres for 46% and networks for 4%.
- 3Worldwide, digital emissions rose by about 6% a year between 2015 and 2019, reaching 3.5% of total emissions.
- 4If nothing changes, France's digital carbon footprint would rise by about 45% from 2020 to 2030, excluding data centres located abroad.
Digital pollution statistics (the environmental impact of devices, networks and data centres, also known as the digital carbon footprint when only greenhouse gases are counted): in France, digital technology accounts for 4.4% of the country's carbon footprint, or 29.5 million tonnes of CO2 equivalent (MtCO2e), and 11% of its electricity, according to ADEME, the French Agency for Ecological Transition (study of January 2025, 2022 data). Devices account for 50% of the digital carbon footprint, data centres (buildings that house servers) for 46% and networks for 4%. Worldwide, The Shift Project (a French think tank) puts digital technology at 3.5% of greenhouse gas emissions in 2019, after emissions grew by about 6% a year between 2015 and 2019.
Key figures, with their source
Each figure comes with its citation, ready to copy into a presentation.
ADEME, January 2025, 2022 data
ADEME, January 2025, 2022 data
ADEME, January 2025, 2022 data
ADEME, January 2025, 2022 data
ADEME, January 2025, 2022 data
ADEME and Arcep, March 2023, 2020 baseline
The 2.5% figure for France comes from the previous edition of the same study, published in January 2022 with 2020 data, which did not count data centres located abroad. This page was last updated on 5 October 2026.
1Key figures on digital pollution, and how to cite them
The fact sheet gives 10 figures, 6 for France and 4 worldwide, each with its source and a full citation to copy.
To cite a figure in a presentation, you need only 3 things: the organisation, the year of publication and the year of the data. In the studies cited here, the 2 years differ: the ADEME study published in January 2025 covers 2022, and The Shift Project note of March 2021 covers 2019. Writing "4.4% in 2025" would therefore give the figure the wrong date.
Each percentage also has a scope, that is, a definition of what it counts. The 4.4% is a share of France's carbon footprint, meaning the emissions linked to what the country consumes, imports included: a phone made in Asia and sold in France is counted in it. The 3.5% from The Shift Project is a share of global greenhouse gas emissions. In these 2 cases, the unit is CO2 equivalent (CO2e), which adds up all greenhouse gases by converting them into CO2.
2In France: 4.4% of the carbon footprint and 11% of electricity consumption
In 2022, the digital goods and services consumed in France emitted 29.5 MtCO2e, out of a national footprint of 671 MtCO2e. According to ADEME, this is slightly less than the total emissions of the heavy goods vehicle sector. Per person, that comes to 434 kgCO2e a year (kilograms of CO2 equivalent), equivalent to driving about 3,050 km in a combustion-engine car (our calculation).
From 2.5% to 4.4%: the 2025 study counts data centres located abroad
Carbon footprint of digital technology in France, in millions of tonnes of CO2e (MtCO2e), from 2 editions of the same study, on the same scale.
2022 study, based on 2020 datadata centres located in France only17.2 MtCO2e2.5% of France's carbon footprint
- 13.6 Mt devices (79%)
- 2.7 Mt data centres (16%)
- 0.9 Mt networks (5%)
2025 study, based on 2022 dataincluding data centres located abroad29.5 MtCO2e4.4% of France's carbon footprint
- 14.6 Mt devices (50%)
- 13.8 Mt data centres (46%)
- 1.1 Mt networks (4%)
Data centres: from 2.7 to 13.8 MtCO2e, or 5 times the level of the previous study. Devices: from 13.6 to 14.6 MtCO2e.
Digital technology also consumes 51.5 terawatt-hours (TWh) of electricity in France, or 11% of national consumption (1 TWh is 1 billion kilowatt-hours). That 11% counts only electricity consumed in France. Adding the data centres located abroad that serve usage in France brings the total to 65 TWh, equivalent to 14% of French consumption.
Why the figure went from 2.5% to 4.4%
The first edition of the study, published by ADEME and Arcep (the French electronic communications regulator) in January 2022, covered 2020: 17.2 MtCO2e (16.9 at publication). It counted only data centres located in France. ADEME estimates, however, that about 53% of digital usage in the country is hosted abroad.
The January 2025 update adds them. The share of data centres rises from 16% to 46% and their emissions from 2.7 to 13.8 MtCO2e, 5 times the previous level (2022 value: our calculation). ADEME also revised the breakdown for televisions and incorporated a study on internet access provision. Overall, emissions come out 70% higher than in the previous study.
The change of scope explains most of this gap: according to ADEME, adding the data centres located abroad alone would have raised the emissions of the 2020 study by 47%, within a total increase of 70%. The move from 2.5% to 4.4% should therefore not be read as a rise between 2020 and 2022. ADEME also describes its results as conservative, meaning that they are more likely to be underestimates: networks outside France and the growth of generative AI are not counted.
3Devices and data centres weigh almost the same, networks far less
ADEME splits the carbon footprint of digital technology into 3 categories. Devices account for 50%: phones, computers, televisions, internet boxes and other connected devices. Data centres account for 46%: they host websites, videos and online services. Fixed and mobile networks make up the remaining 4%.

The manufacturing of all equipment (devices, servers, networks), also known as embodied emissions, accounts for 60% of the carbon footprint of digital technology, distribution and end of life included, while its use accounts for 40%. The previous edition, which did not count the data centres located abroad, gave 78% for manufacturing alone and 21% for use.
The study also counts resources: producing and running this equipment requires 117 million tonnes a year, or 1.7 tonnes per person, all materials combined. The water footprint is not assessed, because ADEME considers the uncertainties in the data too large.
4Per device: manufacturing weighs more than use
A new smartphone has a footprint of 80 kgCO2e over its whole life, of which 99% does not depend on use: manufacturing, transport and end of life. A laptop has a footprint of 193 kgCO2e (96% of it independent of use) and a television 370 kgCO2e (92%), equivalent to about 2,600 km by car (our calculation). These values come from Impact CO2, ADEME's website, and apply to France, where electricity is low-carbon.
From 78% to 99%: a device's footprint comes from the object itself, not from its use
Carbon footprint over the whole life cycle, in kgCO2e, on the same scale.
manufacturing, distribution and end of lifeelectricity over the lifespan assumed by ADEME
Televisionuse: 30 kg over 8 years
370 kgCO2e92% excluding use
Laptopuse: 7.5 kg over 5 years
193 kgCO2e96% excluding use
Tabletuse: 2.8 kg over 3 years
87 kgCO2e97% excluding use
Internet boxuse: 18 kg over 5 years
81 kgCO2e78% excluding use
Smartphoneuse: 0.64 kg over 2.5 years
80 kgCO2e99% excluding use
Sorting your emails does little next to the manufacturing of a device: 1 new smartphone is equivalent to about 33,000 emails of 1 megabyte (MB), to 36 emails a day for 2 and a half years, or to 1,250 hours of online video (our calculations, using ADEME's reference values). The comparison is only indicative, since more than half of the value for the email and for the hour of video comes from the manufacturing of devices (our calculation).
Keeping a device for longer spreads its manufacturing over more years. A smartphone kept for 4 and a half years instead of 2 and a half has a footprint of 18 kgCO2e a year instead of 32, which is 44% less (our calculation). At national level in France, extending the lifespan of devices by 2 years would avoid 5.2 MtCO2e of manufacturing emissions in 2030 compared with the trend, according to ADEME and Arcep.

According to the Baromètre du numérique, a French survey conducted in 2025, 20% of smartphone owners have a second-hand or refurbished one, and 38% of people with at least 1 digital device have had at least 1 repaired in the past 3 years. For smartphones and tablets placed on the market since 20 June 2025, an EU regulation requires manufacturers and importers, or their representatives, to supply spare parts for at least 7 years after the end of sales. See manufacturers' repair obligations (in French).
5Per use, the figures for email, video and AI depend on what is counted
Per-use figures depend on what is counted: for an email, ADEME's values range from 0.11 to 2.5 gCO2e (grams of CO2 equivalent). ADEME's reference value is 2.5 gCO2e for a 1 MB email. 1 hour of online video emits 36 to 64 gCO2e according to the International Energy Agency (IEA) and ADEME. A question to an AI assistant emits about 0.13 gCO2e from server electricity, based on the 0.3 watt-hours (Wh) of energy estimated by the research organisation Epoch AI (our conversion, using the global average carbon intensity of electricity). We cover each of them in the carbon cost of an email, that of TikTok and the environmental impact of AI.
These 3 values do not count the same thing. The 2.5 g for the email and the 64 g for the video include a share of the manufacturing of devices, whereas the 36 g for the video and the 0.13 g for the question to an AI count only electricity.
These per-use values do not explain the national total. Data centres account for 1 to 5% of the footprint of 1 hour of video according to the IEA, the Carbon Trust and ADEME, but for 46% of the digital carbon footprint in France, or about 200 kgCO2e per person per year (our calculation). We found no source that breaks these 200 kg down between video, business services and websites.
6Worldwide: The Shift Project's estimate and how other studies compare
The Shift Project, a think tank, published a global estimate in March 2021: 1.84 billion tonnes of CO2e in 2019, or 3.5% of greenhouse gas emissions, compared with 2.9% in 2013. The calculation covers the manufacturing and use of devices, networks and data centres, including connected televisions and games consoles.
1.84 billion tonnes of CO2e in 2019, or 3.5% of global emissions
Worldwide digital emissions, in GtCO2e, and 4 scenarios for 2025 projected in 2021.
These emissions rose by about 6% a year between 2015 and 2019, a rate equivalent to a doubling in 12 years (our calculation). For 2025, the note describes 4 scenarios, from 1.7 to 3.1 billion tonnes. Leaving aside the sobriety scenario (moderation in equipment and uses), digital technology was projected to account for 5.5 to 6.9% of global emissions in 2025. These projections date from 2021, and we have found no update.
Other studies give different shares, because the year, the scope and the method vary from one study to the next. A 2025 study by GreenIT, a French association, puts the share at 3.4% in 2023, or 1.8 billion tonnes. A study published in 2021 (Freitag et al.) puts it between 2.1 and 3.9% in 2020. Another, published in 2024 (Malmodin et al.), finds 1.4% in 2020, with televisions counted separately.
Worldwide, the electricity consumption of data centres rose from 165 TWh in 2014 to 420 TWh in 2024, excluding cryptocurrencies, according to the summary of The Shift Project's October 2025 report on AI, which cites the IEA; the agency itself publishes 415 TWh for 2024. Including cryptocurrencies, the report puts it at 530 TWh in 2023 and says it could reach 1,250 to 1,500 TWh in 2030, about 3 times France's electricity consumption (our calculation, using the 451 TWh of 2025 according to RTE, the French grid operator). We cover these projections in AI's electricity consumption.
420 TWh in 2024 excluding cryptocurrencies, 1,250 to 1,500 TWh in 2030 including cryptocurrencies
Electricity consumed by data centres worldwide, in TWh per year, on the same scale.
Excluding cryptocurrencies
+7% per year from 2014 to 2019, +13% from 2019 to 2024
Including cryptocurrencies
different scope: not comparable with the 420 TWh for 2024
The Shift Project has itself revised its figures. Its 2018 model gave 4% of global emissions for 2019, with growth of 8% a year. The 2021 model gives 3.5%; for the growth rate, the text of the note gives about 6% a year, while its table 5 gives 5.5%. Its 2025 report gives nearly 4% for 2020, referring back to its 2021 note.
In June 2020, it also acknowledged that a figure given by a member of its team in an interview, 1.6 kg of CO2 for half an hour of video, was wrong because of a unit error in the data rate: 3 megabytes per second instead of 3 megabits per second, which is 8 times too high (our calculation). It states that this figure does not come from its reports.
7Looking ahead: +45% in France between 2020 and 2030 if nothing changes
If nothing changes, the carbon footprint of digital technology in France would rise by about 45% between 2020 and 2030, to 25 MtCO2e, and then to 49.4 MtCO2e in 2050, nearly 3 times the 2020 level. This is the trend scenario of ADEME and Arcep, published in March 2023: it extends observed trends and assumes 6 times as much data traffic and nearly 65% more equipment in 2030.
If nothing changes: +45% between 2020 and 2030, nearly 3 times as much in 2050
Carbon footprint of digital technology in France, in million tonnes of CO2e (MtCO2e).
2020
2022
2030
2050
The same study tests a sobriety scenario, which assumes in particular a stable number of devices and a device lifespan extended by 2 years. According to the study, the footprint would then fall by 16% compared with 2020, to 14 MtCO2e in 2030 (-19% against 17.2 MtCO2e: our calculation). For 2050, ADEME's 4 scenarios range from 9.3 MtCO2e ("Frugal Generation", Génération frugale in French) to 81 MtCO2e ("Reparatory Bet", Pari réparateur in French).
These trajectories were calculated before the 2025 update: they start from 17.2 MtCO2e in 2020 and do not count the data centres located abroad. They therefore do not match the 29.5 MtCO2e estimated for 2022. Generative AI is not included either. According to the summary of The Shift Project's October 2025 report, AI accounts for 15% of the electricity used by data centres worldwide in 2025, cryptocurrencies included (from one fifth to more than one third without them, depending on the estimates), and would account for at least 35% in 2030.
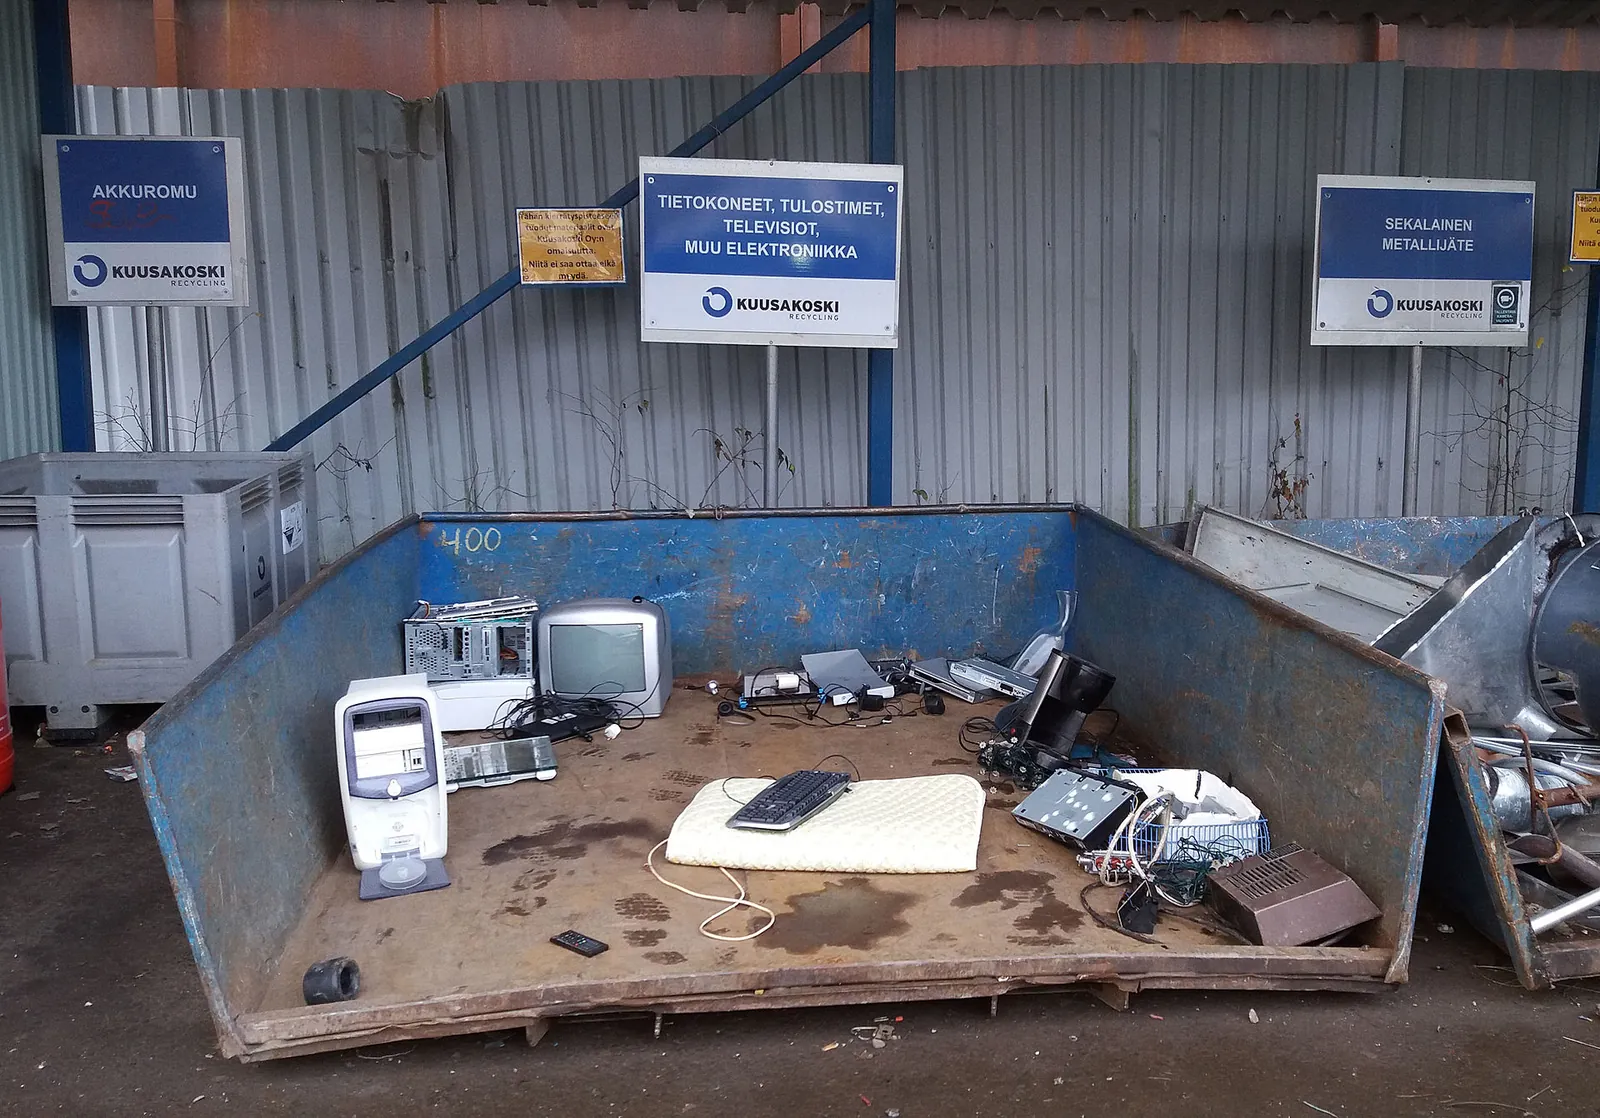
The world produced 62 million tonnes of waste electrical and electronic equipment (e-waste) in 2022, of which 22.3% was documented as collected and recycled; the total is projected to reach 82 million tonnes in 2030, according to ITU (the International Telecommunication Union) and UNITAR (the United Nations Institute for Training and Research), 2 United Nations bodies. This count covers all devices with a plug or a battery, from refrigerators to phones.
8Key takeaways
- Digital technology accounts for 4.4% of France's carbon footprint and 11% of its electricity (ADEME, 2022 data).
- The 2.5% figure dates from the previous edition, which did not count data centres located abroad.
- Manufacturing accounts for 60% of this footprint, and 99% of a smartphone's: keeping devices for longer reduces these emissions.
- Worldwide, The Shift Project puts digital technology at 3.5% of emissions in 2019; GreenIT gives 3.4% for 2023, and 2 other studies 1.4 to 3.9% for 2020.
For a company, the levers are set out in the IT carbon footprint of a company.
- France: ADEME, Évaluation de l'impact environnemental du numérique en France, mise à jour de l'étude ADEME-Arcep, January 2025, 2022 data; Mission interministérielle numérique écoresponsable, Actualisation des chiffres de l'impact du numérique en France, 9 January 2025; ADEME and Arcep, Évaluation de l'impact environnemental du numérique en France et analyse prospective, note de synthèse, 19 January 2022, 2020 data; ADEME and Arcep, analyse prospective à 2030 et 2050, note de synthèse, March 2023, presentation of 6 March 2023 and Arcep's page on this study; RTE, the grid operator, Bilan électrique 2025, for the 451 TWh of weather-adjusted consumption in mainland France in 2025.
- Worldwide: The Shift Project, Impact environnemental du numérique: tendances à 5 ans et gouvernance de la 5G, analysis note, March 2021, 2019 data; The Shift Project, Intelligence artificielle, données, calculs: quelles infrastructures dans un monde décarboné?, synthèse and final report, October 2025; The Shift Project a-t-il vraiment surestimé l'empreinte carbone de la vidéo en ligne?, 15 June 2020; Association Green IT (GreenIT), Impacts environnementaux du numérique dans le monde, 3rd edition, February 2025, 2023 data; Freitag et al., The real climate and transformative impact of ICT: A critique of estimates, trends, and regulations, Patterns, September 2021; Malmodin et al., ICT sector electricity consumption and greenhouse gas emissions, 2020 outcome, Telecommunications Policy, April 2024; ITU and UNITAR, The Global E-waste Monitor 2024, 20 March 2024, 2022 data; ATAG, Facts and figures, accessed on 3 October 2026: ATAG is an aviation industry association; International Energy Agency, Electricity 2026, for the global average carbon intensity of electricity (435 g of CO2 per kilowatt-hour in 2025).
- Devices and uses: ADEME, Impact CO2, numérique and its detailed values, accessed on 4 October 2026; ADEME, Impact CO2, valeurs de référence des usages numériques for the email (2.46 g) and the hour of video (64 g): the simulator on the same page displays other values depending on its settings, including 0.11 g for an email without an attachment, which leaves out the manufacturing of the phone; International Energy Agency, The carbon footprint of streaming video, December 2020, and Carbon Trust, Carbon impact of video streaming, June 2021; Epoch AI, How much energy does ChatGPT use?, February 2025; Arcep, Arcom, CGE and ANCT, Baromètre du numérique, 2026 edition, 9 February 2026, CRÉDOC survey on 2025 (Arcom is the French audiovisual and digital regulator, the CGE the General Council for the Economy, ANCT the National Agency for Territorial Cohesion and CRÉDOC a French research centre on living conditions); Commission Regulation (EU) 2023/1670 of 16 June 2023 and its presentation by the European Commission.
- Images: Opening photo: Jeremy Keith, Wikimedia Commons, CC BY 2.0, cropped. Optical fibre works at Cosne-Cours-sur-Loire: Cjp24, Wikimedia Commons, CC BY-SA 4.0, cropped. Mountain Pass mine: Tmy350, Wikimedia Commons, CC BY-SA 4.0. Electronic waste in Jyväskylä: Tiia Monto, Wikimedia Commons, CC BY-SA 4.0.
- The Shift Project charts: We redrew the 2 charts in the worldwide section, based on The Shift Project: the emissions chart is based on the note of March 2021 (pp. 14 to 16: table 3, figure 2, table 5), the data centre chart on the summary and final report of October 2025. Table 3 of the note gives 6% a year from 2015 to 2019, its table 5 gives 5.5%; we use about 6%, the wording in the text of the note. The 2014 and 2024 values in the data centre chart are attributed by The Shift Project to the International Energy Agency; the 2030 range and the 530 TWh for 2023 come from the final report. The legal notice of The Shift Project's website, read on 4 October 2026, allows its content to be reused for information and debate, provided the content is not distorted and the author is cited; we found no open licence in its reports, hence the decision to redraw the charts.