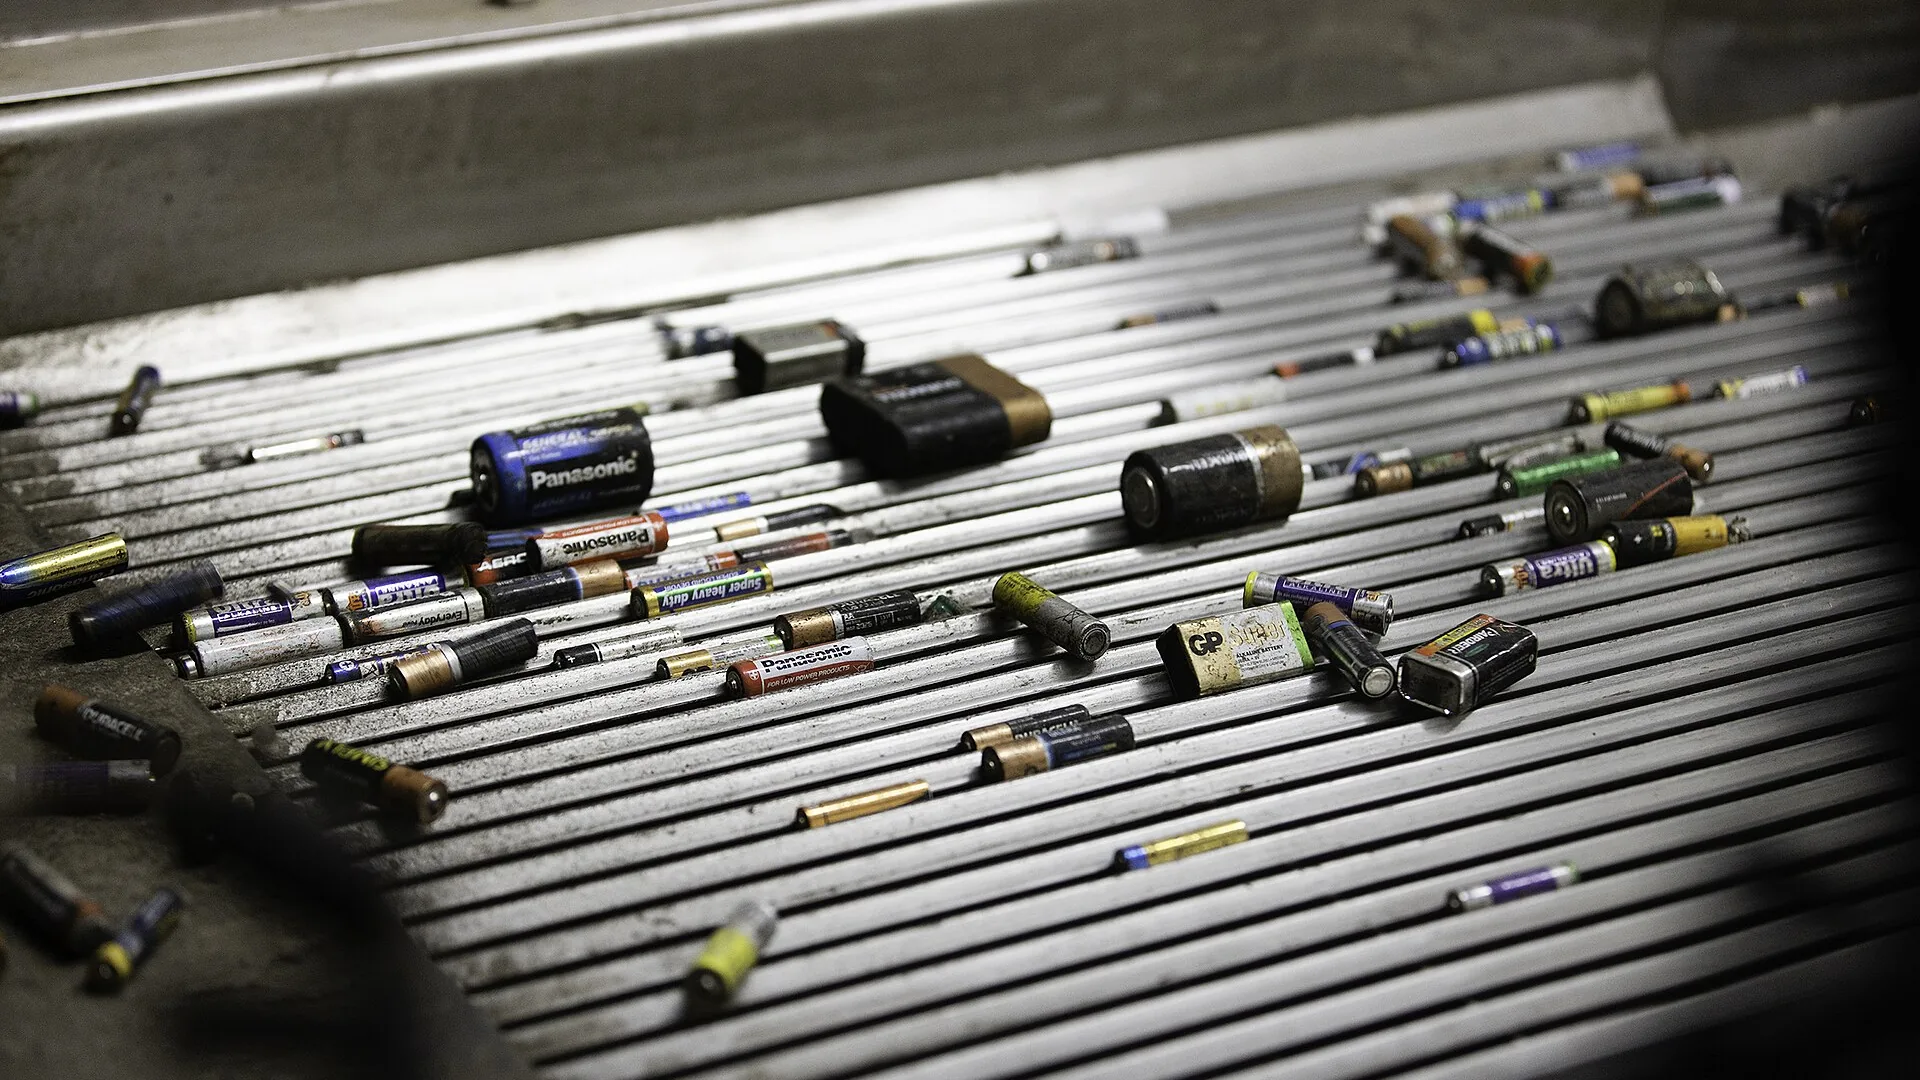

- 1GreenIT estimates that AI emitted up to as much greenhouse gas as Belgium in 2025.
- 2AI is estimated to have used electricity equal to 22 to 39% of France's consumption.
- 365% of the environmental footprint of AI lies in impacts other than climate, according to the GreenIT study.
- 4A year of regular AI use emits about 2.8 kgCO2e from server electricity, the same as driving 20 km.
The environmental impact of artificial intelligence (AI) goes beyond its CO2 emissions. In 2025, AI is estimated to have emitted up to as much greenhouse gas as Belgium and to have used electricity equal to 22 to 39% of France's consumption. According to the GreenIT association, 65% of its environmental footprint lies in impacts other than climate: mainly freshwater pollution, fossil resource depletion and fine particles. AI also affects water consumption, metals and land.
The 6 impacts of AI, each as an order of magnitude
Worldwide, in 2025. Choose an impact to see its figures.
ClimateEstimate from a study
- In 2025
- 99 million tonnes of CO2e, or 0.17% of global emissions.
- In 2030
- 636 million tonnes according to the same study, or 1.7 times the emissions of France.
For one person, regular use has a small footprint: 10 questions a day plus, each week, 5 images and 1 video lasting 5 seconds emit about 2.8 kg of CO2 equivalent (kgCO2e) a year from server electricity, by our calculation, the same as 20 km of driving. Worldwide, the electricity consumption of data centres (the buildings full of servers where the models run) rose by 17% in 2025, and forecasts for 2030 put it at 2 to more than 3 times the electricity consumption of France.
1The 6 environmental impacts of AI
One question or the whole world: 2 scales of reading
Most of these impacts can be read at 2 scales. At the scale of a single question, image or video, you can compare uses with one another: a few AI providers publish figures for the written question, but for images and video we found only measurements by researchers. At the scale of the world, estimates by agencies and associations show what the whole adds up to.
The 2 main sources for global figures
The International Energy Agency (IEA) tracks the electricity and water consumption of all data centres, whether or not they serve AI. In September 2026, GreenIT published the only worldwide life cycle assessment (LCA) (in French) of AI that we have found: it reports 15 impacts, from the manufacture of servers to their end of life, excluding users' devices.
GreenIT's totals are the highest we have found, so we read them as an upper bound. The 6 headings of this article are our own breakdown and do not line up with those 15 impacts; the comparisons (a country, football pitches, kilometres driven) are our calculations. Our article on why AI is bad for the environment describes 4 stages, from the manufacture of chips to the answer.
2Climate: up to as much greenhouse gas as Belgium
AI's emissions worldwide, in 2025 and 2030
According to GreenIT, AI emitted 99 million tonnes of CO2 equivalent in 2025, including the manufacture of servers. Belgium emitted 98 million tonnes in 2024. The AI figure also equals 11% of the CO2 emitted by world aviation in 2023 and 0.17% of global greenhouse gas emissions.
For 2030, the same study forecasts 636 million tonnes: emissions multiplied by 6.4, or 1.7 times the emissions of France, if electricity remains as carbon-intensive as in 2025. The IEA counts only electricity, but for all data centres, and reaches 180 million tonnes of CO2 in 2024 and about 320 million in 2030.
From 2025 to 2030, the electricity used by AI would be multiplied by 6.7 and the number of graphics cards by 1.9
Forecasts by the GreenIT association for AI worldwide: each line starts at 1 in 2025. Graphics cards are the computing chips used for AI.
- Electricity174 TWh in 2025, 1,169 TWh in 2030x 6.7
- Greenhouse gases99 million tCO2e in 2025, 636 million tCO2e in 2030x 6.4
- Data centre floor area350 ha in 2025, 2,300 ha in 2030x 6.5
- Graphics cards13 million in 2025, 25 million in 2030x 1.9
GreenIT's estimate rests on the highest electricity consumption we have found: scaled down in proportion to the low estimate, the total would be around 60 million tonnes, by our calculation. Nor does it count the same things as the IEA's estimate. GreenIT covers AI alone and adds the manufacture of servers and all greenhouse gases to electricity; the IEA keeps to the CO2 of power stations, but for all uses of data centres. According to the agency, these 180 million tonnes represent 0.5% of global CO2 emissions from energy combustion.
One question, one image, one video: a ratio of 1 to 300
Per use, the spread is a ratio of 1 to 300. With global average electricity, by our calculations, a written question emits about 0.13 gCO2e, a generated image 1.3 g and a 5-second video 39 g, the same as 280 metres of driving. These are points of reference: depending on the study, the generator and its settings, published measurements range from 0.04 to 5 gCO2e for an image and from 0.06 to 180 gCO2e for a video. Our articles give the details of what an AI-generated image emits, what an AI-generated video consumes and the energy consumption of a ChatGPT query.
The same use emits at least 8 times less with French electricity
These values depend on the country where the server runs. In France, 1 kWh of electricity consumed emits 51.9 gCO2e according to ADEME (the French Agency for Ecological Transition), whereas 1 kWh generated worldwide emits on average 435 g of CO2 according to the IEA. The same use therefore emits at least 8 times less on a server powered by the French grid. Our guide to the carbon footprint of AI in a company starts from these values to put a figure on the AI use of an SME.
3Electricity: 22 to 39% of France's consumption
In 2025, between a fifth and more than a third of France's consumption
AI is estimated to have consumed between 100 and 174 TWh of electricity in 2025 (terawatt-hours, or billions of kWh). The low estimate, published by Schneider Electric in 2024, is taken up by the Shift Project, a French think tank; the high estimate is GreenIT's. Metropolitan France consumed 451 TWh in the same year. All data centres combined, whether for AI or not, consumed 485 TWh: slightly more than France.
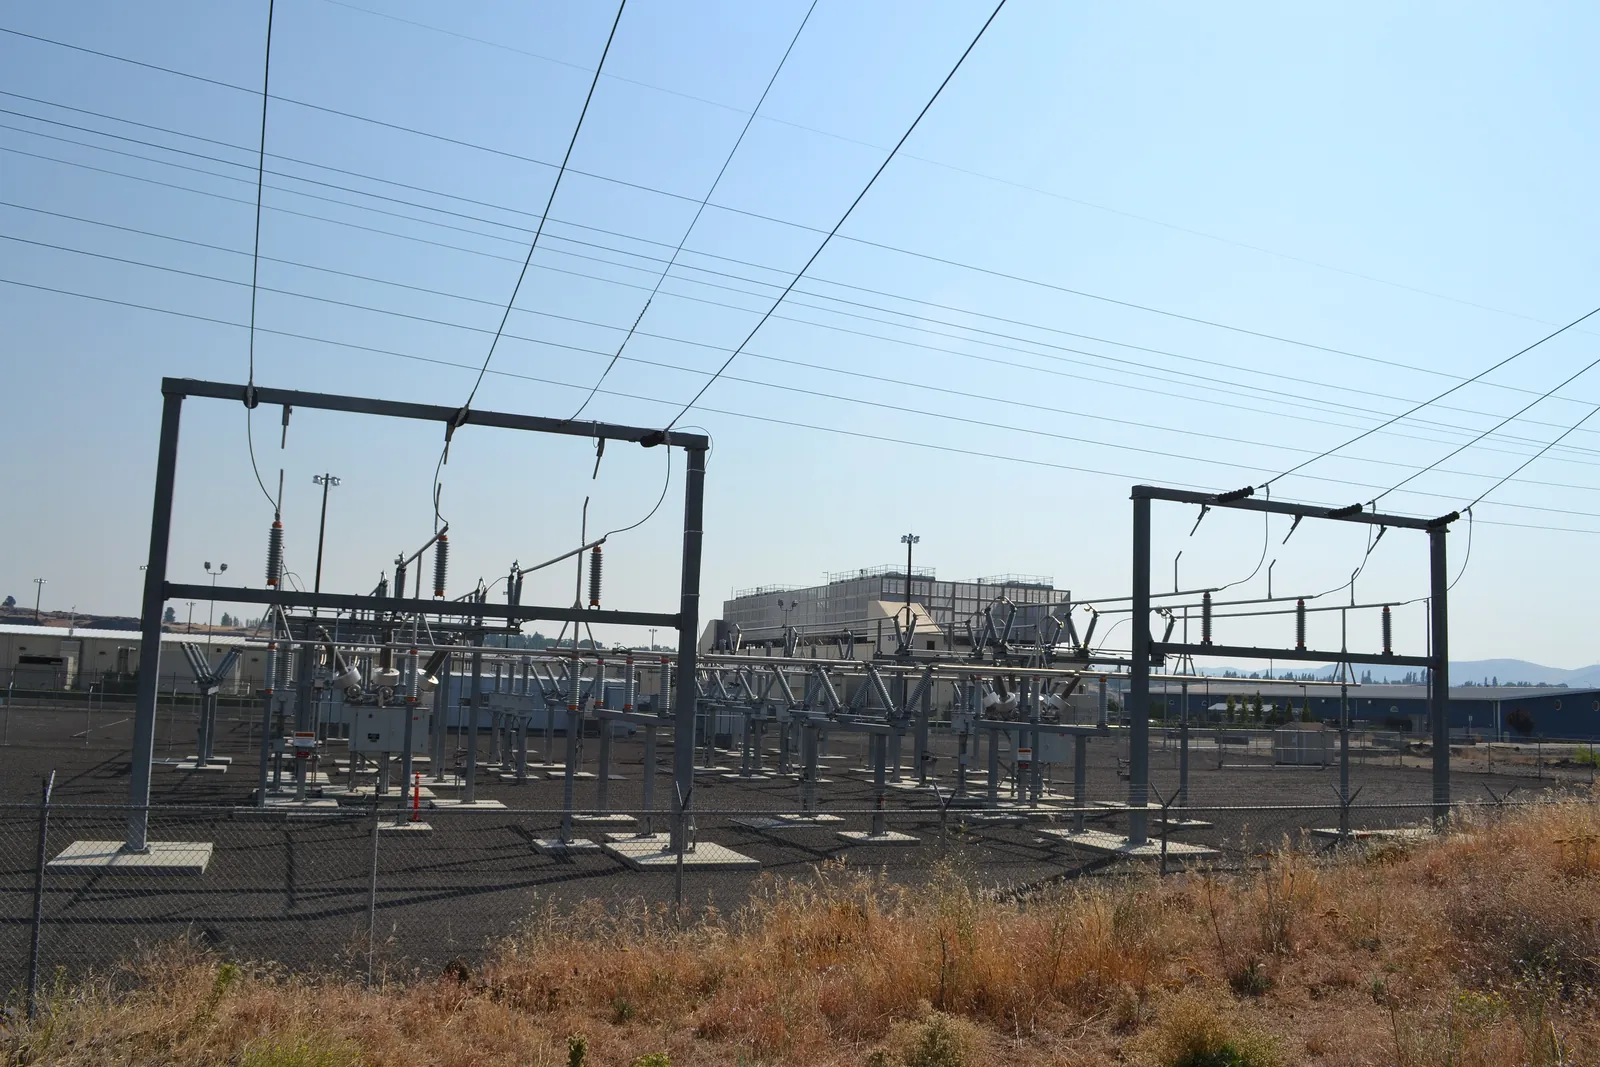
This consumption is concentrated in a few regions: according to the IEA, the United States accounts for nearly half of it, China a quarter and Europe 15%. In a single country the share may be higher: in Ireland, data centres took 23% of the electricity metered in 2025.
In 2030, 2 to more than 3 times France's consumption for all data centres
For 2030, the IEA forecasts 945 TWh for all data centres together, or 2.1 times France, of which nearly half (465 TWh) is for data centres specialised in AI, that is, equipped mainly with graphics cards (GPUs), the computing chips used for AI. The Shift Project extrapolates current trends and reaches 3.3 times France, also counting cryptocurrencies, which the IEA excludes. Our article on the electricity consumed by AI compares these forecasts and their assumptions.
In France, data centres located on dedicated sites consumed 4 to 5 TWh in 2024, or about 1% of France's electricity. RTE, the French electricity transmission system operator, quantifies 2 trajectories for 2030, 10 and 15 TWh, equal to 2 to 3% of the country's consumption in 2025.
4Water: from a few drops to 3 tablespoons per question
The world's data centres, whether or not they serve AI, consume about 560 billion litres of water a year, according to the IEA (April 2025): by our calculation, as much as the annual household water consumption of about 11 million people in France. Two thirds of it is used to generate their electricity, a quarter to cool the servers and the rest to manufacture the chips. This is water consumed, that is, withdrawn and not returned to the environment. The agency forecasts about 1,200 billion litres in 2030.
Per question, published figures range from 0.26 mL at Google, which counts the cooling water of its data centres, to 45 mL at Mistral AI, whose life cycle assessment measures a response of about 320 words, excluding the user's device: a ratio of 1 to 170. Our article on the water consumption of AI explains these scopes.
5Metals and hardware: servers assumed to last 3 years
In an AI motherboard, memory accounts for more of the footprint than the computing chips
AI runs on graphics cards, chips specialised in computing. Nvidia puts 8 of them on a motherboard, the board that connects them. According to Nvidia, manufacturing one of these motherboards emits 1,312 kgCO2e, of which 42% comes from the memory, more than from the computing chips themselves. The next generation reaches 2,274 kgCO2e, or 73% more.
In a motherboard with 8 graphics cards, memory accounts for 42% of the manufacturing footprint, more than the computing chips
Carbon footprint of manufacturing a motherboard with 8 graphics cards, according to its manufacturer: 1,312 kgCO2e. Each square represents about 1%.
- Memory42%
- Integrated circuits25%
- Thermal components18%
- Assembly9%
- Electromechanical4%
- The rest3%
In May 2026, ADEME published a life cycle assessment of 8 graphics cards: 60 to 150 kgCO2e per card for manufacturing, distribution and end of life, excluding use. Per card, Nvidia's measurement works out at about 160 kgCO2e, networking chips and heat sinks included. According to Greenpeace East Asia, the electricity needed to etch 5 families of AI chips in Taiwan, South Korea and Japan was multiplied by 4.5 between 2023 and 2024.
A 3-year lifetime in the calculations, and little detail on metals
GreenIT assumes a 3-year lifetime for AI servers in its calculations, and forecasts that the mineral resources used would be multiplied by 4.3 between 2025 and 2030. In the life cycle assessment that Mistral AI published for one of its models, server hardware (manufacture, transport and end of life) accounts for 61% of mineral resource depletion, against 11% of greenhouse gas emissions. Mistral AI presents this assessment as a first approximation, as no reliable inventory of graphics card manufacturing was available in 2025.
None of the published documents we found breaks down the metals involved. The 2 studies express them as a single reference metal, antimony, just as greenhouse gases are converted into CO2 equivalent.
Up to 5 million tonnes of electronic waste by 2030
At end of life, servers and chips become electronic waste (e-waste). For generative AI, this waste could amount to a cumulative 1.2 to 5 million tonnes between 2020 and 2030, depending on the scenarios of a 2024 study. That is 2 to 8% of what the world produces in a single year, 62 million tonnes in 2022, of which less than a quarter is collected and recycled in a documented way. According to the same study, circular economy strategies would reduce this waste by 16 to 86%.

6Land, air and health: what carbon does not show
Nearly 500 football pitches of server rooms
According to GreenIT's calculation, AI servers occupy about 350 hectares of rooms worldwide, nearly 500 football pitches. The study forecasts a floor area 6.5 times larger in 2030. This figure counts only the area occupied by the servers and their cooling, excluding the rest of the buildings, their grounds, and the mines, factories and power stations that supply them.
Fine particles: thousands of cases of disease, according to a model
GreenIT converts the fine particles emitted over the life cycle of AI into about 3,200 cases of disease for 2025 and 20,600 for 2030. This is an indicator calculated by a model in a life cycle assessment, not a count of people who fall ill, and we did not find which diseases and which countries are involved.
65% of the footprint of AI lies outside climate
To compare impacts of different kinds, GreenIT expresses them against a common benchmark, the amount the planet can bear per person, and then weights them. On this method, climate accounts for 35% of the footprint of AI. Freshwater eutrophication, that is, an excess of phosphorus that makes algae proliferate, accounts for 23%, the depletion of fossil resources (coal, gas, oil) for 17% and fine particles for 15%.
Climate accounts for 35% of the footprint of AI, and 3 other impacts account for 55%
The footprint of AI worldwide in 2025, with its impacts converted to a common unit and then weighted according to the study's method.
Freshwater eutrophication: 23% of the footprintThe excess phosphorus discharged into rivers and lakes: it makes algae proliferate and deprives the water of oxygen.
According to the study, electricity generation explains most of these impacts: the use phase, that is, the electricity the equipment consumes to train the models and to answer questions, accounts for 92% of the footprint and manufacturing for 7%. How the electricity of a data centre is generated therefore changes the result across several impacts at once.
7Why the published figures differ
A written question emits 0.016 gCO2e if only the electricity of a server in France is counted, 0.03 g according to Google, 0.13 g with global average electricity and 1.14 g according to Mistral AI for a response of about 320 words: a ratio of 1 to 70 between 4 figures that measure different things.
A written question emits from 0.016 to 1.14 gCO2e depending on what is counted
4 figures, published or calculated, on a scale where each tick mark is worth 10 times the previous one: a ratio of 1 to 70.
6 methodological choices that change the result
- The electricity counted may be that of the local grid or that of the renewable electricity contracts the company has signed. For Meta in 2024, the result ranges from 1,358 tCO2e to 5.97 million tonnes: a ratio of 1 to 4,400.
- The country of the server changes emissions by a factor of 8 between France and the global average.
- The water counted may be limited to cooling, or include electricity generation and chip manufacturing.
- The scope may stop at server electricity, or add cooling, hardware and, more rarely, the training of the model.
- The question measured differs: Google takes the typical (median) question, Mistral AI a response of about 320 words.
- The utilisation rate used to extrapolate to the world varies: GreenIT uses 69% for AI servers, whereas the IEA uses a load factor of 48% for all data centres together, and the 2 rates do not measure exactly the same thing.
How to read the GreenIT study: our interpretation
The GreenIT study is the only one we have found that reports 15 impacts at global level, using a life cycle assessment method governed by ISO standards. Its totals are also the highest: for 2025 it counts 174 TWh, whereas the IEA's figures imply less than 155 TWh for AI-specialised data centres, and for 2030 it forecasts 1,169 TWh for AI alone, more than the IEA's 945 TWh for all data centres.

In our reading, 3 assumptions explain this. The study starts from forecast sales of graphics cards, with no limit set by grid connection or building construction, a caveat that its authors state themselves. It assumes that the power of each card triples, from 700 to more than 2,000 watts, and that servers run at 69% of their capacity all year round. For emissions, it keeps electricity at its 2025 carbon intensity until 2030 and states that bringing gas or coal power stations into service would worsen the result.
We therefore read its totals as an upper bound and its breakdowns as its main contribution: the share of climate in the footprint, that of electricity and that of manufacturing. The study does not count users' devices or access networks, and describes itself as a partial view of the impacts of AI.
8Individual use or the system: where the impact lies
A year of regular use: about 2.8 kgCO2e
We chose a regular-use profile: 10 written questions a day, plus 5 images and 1 video lasting 5 seconds a week. With global average electricity, this profile emits about 2.8 kgCO2e a year from server electricity, by our calculation: the same as driving 20 km, or 0.03% of the annual carbon footprint of a person in France. Video accounts for about 70% of it with the generator we chose; depending on the generator and its settings, the total would range from 0.8 to 10 kgCO2e. In electricity terms, that comes to 6.5 kWh, what a person in France consumes at home in a single day.
A year of regular AI use amounts to about 2.8 kgCO2e, of which video accounts for 70%
The sum over one year of a usage profile that we chose, counting only the electricity used by servers.
3,650written questions10 per day
480 gCO2e
260generated images5 per week
330 gCO2e
525-second videos1 per week
2 kgCO2e
What this total represents
- 20 km
- by car
- 57%
- of the emissions of a beef meal
- 0.03%
- of the annual carbon footprint of a person in France
All the world's searches put to an AI: less than 1% of data centre electricity
According to the IEA, if all the searches made on the internet became written questions put to an AI, about 10 billion a day (4 times the volume reported by ChatGPT in mid-2025), they would consume less than 4 TWh a year, or about 1 Wh per question by our calculation: less than 1% of the electricity consumed by data centres. Our article on a ChatGPT question compared with a Google search goes into this order of magnitude in detail.
Beyond text: video, agents and the race for computing power
According to the IEA, generating a video may require hundreds to thousands of times more energy than a simple written question, and agents (systems that chain together dozens of actions on their own) use several orders of magnitude more computing, a factor of 100 or more. The electricity consumption of AI-specialised data centres rose by 50% in 2025, and large technology companies invested more than $400 billion that year.
Efficiency gains do not necessarily translate into a decrease. Google says that the electricity used by a question put to its Gemini assistant fell by a factor of 33 between May 2024 and May 2025, yet its total electricity consumption, across all its services, rose by 37% in 2025.
What can be done, by individuals and by companies
For an individual, some choices weigh more than others: one generated video emits as much as 300 written questions, and our calculator recalculates the total with other uses. One of our articles explains how to reduce the impact of your AI use, and another which AI to choose to limit its impact, with the published measurements for ChatGPT, Claude and Gemini. We also examine the arguments of those who ask whether to stop using AI.
For a company, the first step is to measure: our guides explain how to include AI in a Bilan Carbone® (the French carbon accounting method) and how to measure the digital carbon footprint of a company. AI is only one part of digital technology: our summary of digital pollution in figures puts it in that wider context, alongside the carbon footprint of an email, that of TikTok or that of a website.
9Key takeaways
- AI is estimated to have emitted up to as much greenhouse gas as Belgium in 2025, according to GreenIT, whose assumptions are high; the same study forecasts 6.4 times as much in 2030.
- AI is estimated to consume the equivalent of 22 to 39% of France's electricity consumption, depending on the estimate, while all data centres combined consume slightly more than France.
- 65% of the environmental footprint of AI lies in impacts other than climate, according to GreenIT, mainly freshwater pollution, fossil resource depletion and fine particles.
- Metals are where hardware matters most: server hardware accounts for 61% of mineral resource depletion in Mistral AI's assessment, and electronic waste could total up to 5 million tonnes by 2030.
- A year of regular use emits about 2.8 kgCO2e, 70% of it from video; worldwide, 10 billion written questions a day would account for less than 1% of the electricity consumed by data centres, according to the IEA.
The environment is not the only area where the effects of AI are measured: 2 other articles in this series review the studies on the impact of AI on the brain and on the impact of AI on jobs.
- Global scale: GreenIT association, Impacts environnementaux de l'intelligence artificielle dans le monde (Environmental impacts of artificial intelligence worldwide, our translation), September 2026, summary pp. 4 to 13 and full report p. 21; IEA, Energy and AI, April 2025, pp. 14, 18, 87, 242, 243, 249 and 250; IEA, Key Questions on Energy and AI, 16 April 2026, pp. 9, 10, 26, 29, 33 and Tables A.1 and A.4; The Shift Project, Intelligence artificielle, données, calculs : quelles infrastructures dans un monde décarboné ? (Artificial intelligence, data, computing: what infrastructure in a decarbonised world?, our translation), final report, October 2025; RTE, Bilan électrique 2025 (Electricity report, our translation), February 2026; RTE, Bilan prévisionnel 2025-2035, chapitre consommation (Forecast report, consumption chapter, our translation), December 2025; Central Statistics Office, Data Centres Metered Electricity Consumption 2025, 7 July 2026; Insee, Bilan démographique 2025 (Demographic report, our translation) (Insee is the French national statistics institute). The pages of GreenIT, the Shift Project, RTE, Insee, Citepa, Sispea, SDES and ADEME (Base Carbone and Impact CO2) cited in these sources are in French.
- Per use and per provider: Epoch AI, How much energy does ChatGPT use?, 7 February 2025; Luccioni, Jernite and Strubell, Power Hungry Processing, 2024; Delavande, Pierrard and Luccioni, Video Killed the Energy Budget, 2025; Google, Measuring the environmental impact of delivering AI at Google Scale, August 2025; Google, 2026 Environmental Report, June 2026; Mistral AI, Our contribution to a global environmental standard for AI, 22 July 2025; Meta, 2025 Environmental Data Index, 2025; ADEME, Base Carbone, average consumption mix, 2024; IEA, Electricity 2026, February 2026, p. 105.
- Hardware and waste: Nvidia, HGX H100 Product Carbon Footprint Summary and HGX B200 Product Carbon Footprint Summary, 2025, p. 3; ADEME, Life cycle assessments of GPUs for artificial intelligence, May 2026 (presentation); Greenpeace East Asia, Chipping Point, April 2025, pp. 7 and 20; Wang et al., E-waste challenges of generative artificial intelligence, Nature Computational Science, 2024 (abstract); UNITAR and ITU, The Global E-waste Monitor 2024, March 2024.
- Comparison benchmarks: Eurostat, greenhouse gas emissions by source sector (env_air_gge), updated 2 June 2026; Citepa, Secten 2026 report, summary, June 2026 (Citepa is the French technical centre for atmospheric pollution studies); ATAG, Facts and figures, accessed 3 October 2026; UNEP (United Nations Environment Programme), Emissions Gap Report 2025, press release, 4 November 2025; Sispea Observatory of public water and sanitation services, report on 2024 data, June 2026; IFAB (International Football Association Board), Laws of the Game 2025/26, Law 1; SDES, L'empreinte carbone de la France de 1990 à 2024 (The carbon footprint of France, our translation) (SDES is the statistics department of the French ministry for ecological transition); ADEME, Impact CO2, accessed 2 October 2026.
- Images: Opening photo: Choinowski, Wikimedia Commons, CC BY-SA 4.0, cropped. The Dalles: Visitor7, Wikimedia Commons, CC BY-SA 3.0. Agbogbloshie: Muntaka Chasant, Wikimedia Commons, CC BY-SA 4.0. Silicon wafer: Intel in Deutschland, Wikimedia Commons, CC BY-SA 2.0, cropped. Adastra: Rambiera, Wikimedia Commons, CC BY-SA 4.0.