
- 1A query uses a few drops of water: 0.26 mL measured for Gemini, ~0.3 mL cited for ChatGPT.
- 2Published figures range from 0.26 to 519 mL because they do not count the same water.
- 3"Half a litre per query" is a misleading shortcut, taken from studies that counted total water or whole sessions.
- 4Location decides: the same query matters little in Sweden but a great deal in Arizona, where water is already scarce.
Searching Google for "ChatGPT water usage" quickly turns up a striking claim: each AI query supposedly "drinks" a bottle of water. The published figures are far lower. Servers are cooled with water, and the only 2 figures that AI providers have put forward for a single query come to a few drops: 0.26 mL measured by Google for Gemini and ~0.3 mL cited by Sam Altman for ChatGPT.
Calculator: how much water does an AI query consume?
Choose a scenario: the volume of water evaporated, its tangible equivalent and its position on a scale from a drop to an Olympic swimming pool.
Logarithmic scale: each tick multiplies the volume, from 0.05 mL to 2,500 m³.
These volumes cover only the cooling water evaporated on site; they exclude the water used to generate the servers' electricity and the manufacture of the hardware. Volume does not tell the whole story: the same query has a small footprint in Sweden and a large one in Arizona, where data centres draw on water basins that are already under strain.
This leaves open where the "half a litre" figure comes from, why published figures range from 0.26 to 519 mL, and at what scale AI's water use becomes a real issue. On the energy side, a query uses around 0.3 Wh; this article is about water, which is quantified far less often.
1A ChatGPT query uses a few drops of water
Only one figure comes from a measurement in production: Google puts a median Gemini query at 0.26 mL of water, about 5 drops, in its August 2025 study. For ChatGPT there is no measurement: in a June 2025 blog post, Sam Altman cited ~0.3 mL for an average query, with no stated method or scope. The 2 figures are close, and both count only the data centre's cooling water, not the water used to generate its electricity.
- A Gemini query: 0.26 mL, or 5 drops of water. This is the only figure that has been measured and published, by Google, and it leaves out the water tied to electricity.
- A ChatGPT query: ~0.3 mL according to Sam Altman, one fifteenth of a teaspoon, taken from a statement on his blog rather than an audited measurement.
- A teaspoon (5 mL): about twenty queries.
- A glass of water (25 cl): around 1,000 queries.
This figure varies widely with the model and the task, as energy use does: the gap between models reaches a factor of 100. The "half a litre per query" that circulates is a genuine figure, but misquoted: a 2023 study counted 500 mL for 10 to 50 responses from GPT-3 (UC Riverside), not for a single one.
The same team then estimated ~519 mL for a 100-word email generated by GPT-4, a figure that counts total water, electricity included (Washington Post). Like the "10x" claim in the comparison with a Google search, the "half a litre" keeps circulating without the scope that gave it meaning.
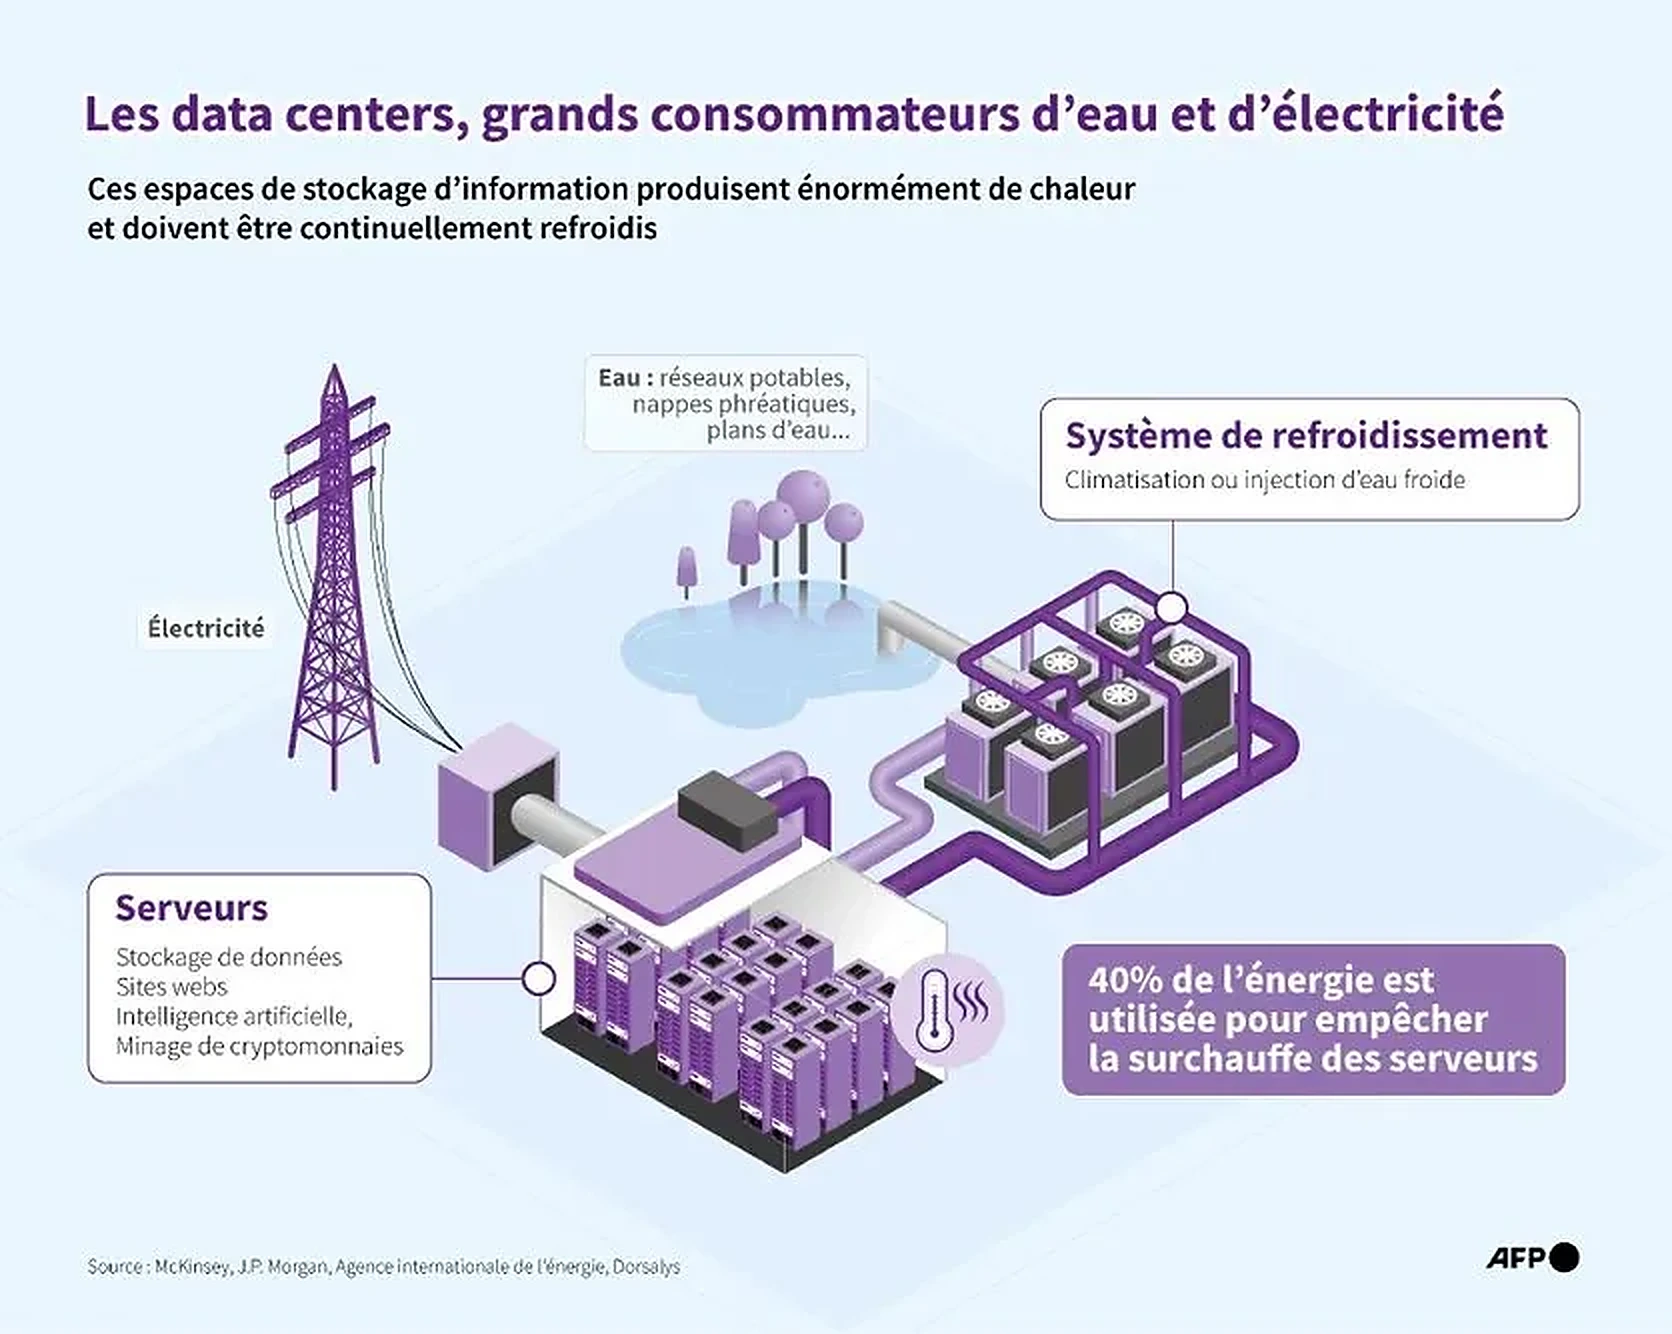
A data centre depends on two flows: the electricity that powers the servers, and the water that removes their heat by evaporation. No "water per query" figure can be read without its scope.
2Why data centres use water, and when it becomes a problem
A few drops per query are not a problem in themselves. The difficulty lies in the cooling mechanism, through which water is lost to evaporation, and above all in where your queries are processed.
Water is used for cooling
What matters is the difference between water withdrawn and water consumed. A data centre withdraws water, returns part of it to the environment and evaporates the rest: Google states that 80% of the water withdrawn by its sites is consumed, and therefore lost to the local basin. There is also a hidden water cost: the water used to generate the electricity that powers the servers. In some countries this indirect water use outweighs cooling, and it is precisely this water that Google's 0.26 mL leaves out.
Everything depends on where your queries are processed
Location decides almost everything. A data centre in Sweden is cooled with cold air for much of the year, whereas a site in Arizona or the Persian Gulf depends far more on evaporation, in regions that are already short of water. With the same model and the same query, the footprint differs completely from one site to another, and you do not choose which site handles yours. Location matters in the same way for carbon: electricity in Sweden emits about 10 times less CO2 per kWh than the average in the United States.
The same query, 4 water footprints
The local water basin and cooling matter more than the model; you do not choose where the query is processed.
Arizona, Texas, Virginia · Wet cooling towers
Documented local water stress. Growing public opposition.
Qualitative levels: the physical mechanism is known, precise figures by region are not published.
3Which water figures are reliable, and how to read them
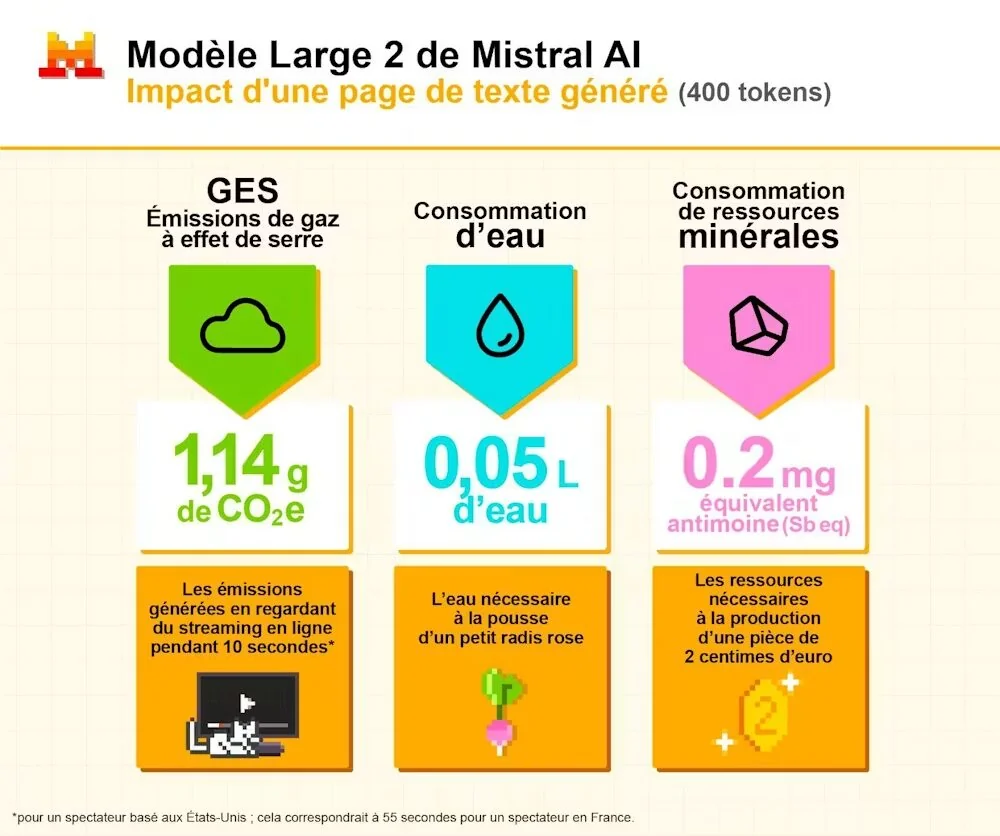
Only 3 AI providers have published a figure, and each counts something different. Google publishes a measurement made in production: 0.26 mL, cooling only. OpenAI relies on a statement by its chief executive in a blog post, with no method given. Mistral has published a full life cycle assessment (LCA) (in French) with Carbone 4 and ADEME (the French Agency for Ecological Transition): 45 mL per response of 400 tokens (tokens are the word fragments a model processes), server manufacturing included. Anthropic and Microsoft publish no figure per query.
5 orders of magnitude for water consumed by AI queries
None of these figures is wrong: they do not count the same things. Click to read the boundaries and sources.
What the figure counts: Cooling water evaporated on site, measured in production across Google's AI fleet. This is the most reliable figure on the market.
What it excludes: Water used to generate electricity and manufacture servers.
≈ 5 drops of water · Google study, August 2025 (arXiv 2508.15734)
Why published figures range from 0.26 to 519 mL
Set side by side, the published figures run from 0.26 to 519 mL, a factor of 2,000. None of them is wrong: the first counts the cooling water of a median query, the last the total water of a long output from GPT-4, the largest model in service at the time. In between, the standard academic estimate puts a GPT-3 response at 10 to 50 mL of total water, and the Mistral LCA puts a response from Le Chat, Mistral's chatbot, at 45 mL. So before quoting a water figure, you need to know what it counts.
Three habits for reading a water figure
- Check the scope: cooling only, electricity included or full life cycle. The gap between these scopes ranges from a factor of 10 to a factor of 100.
- Be wary of fleet averages: an average indicator pools sites in Finland and Arizona, and so describes no real site.
- Distinguish water withdrawn from water consumed: Amazon Web Services (AWS) publishes 0.15 L/kWh of water withdrawn and Google 1.15 L/kWh of water consumed, so the 2 indicators cannot be compared like for like.
In practice, this means reasoning in orders of magnitude (in French) rather than in measurements. For an organisation, water is not handled in a Bilan Carbone® (the French carbon accounting method), which looks only at carbon, but in a multi-criteria LCA, with the range and the uncertainty stated openly. On the carbon side, AI use fits into Scope 3 of your carbon footprint.
From the 0.26 mL measured by Google to the 519 mL for a GPT-4 email, published figures differ by a factor of 2,000 and none of them is wrong: they do not count the same water.
4From a drop to an Olympic pool: the AI water footprint at scale
As an order of magnitude for a company, take 100 people who send 25 queries a day over 220 working days: that adds up to 550,000 queries a year. At 0.26 mL per query, this comes to 143 litres of water over the year, the equivalent of a bathtub, or 1.4 litres per person. Even at the widest LCA scope (45 mL), the total reaches ~25 m³: real, but marginal in the footprint of a services company, where equipment far outweighs online services.
The change of scale comes from the infrastructure. In 2021, an average Google data centre evaporated around 1.7 million litres a day, two thirds of an Olympic pool. In 2025, Google consumed 41 billion litres of water across its data centres and offices, 34% more than in 2024 and more than double the 2021 level. Worldwide, the International Energy Agency (IEA) puts data centre water consumption at ~560 billion litres in 2025 and projects 1,200 billion litres in 2030, 2.1 times as much within 5 years, driven by the rise of AI (which accounts for 5 to 15% of data centre electricity today and could reach 35 to 50% in 2030). The report from United Nations University (UNU-INWEH, the United Nations University Institute for Water, Environment and Health, June 2026) gives much higher volumes: 4,500 billion litres as early as 2025, enough to meet the water needs of more than 600 million people in sub-Saharan Africa, and 9,300 billion litres in 2030, equal to the annual needs of the region's 1.3 billion inhabitants. The UN figures are 7 to 8 times the IEA's, which shows how uncertain these volumes are.
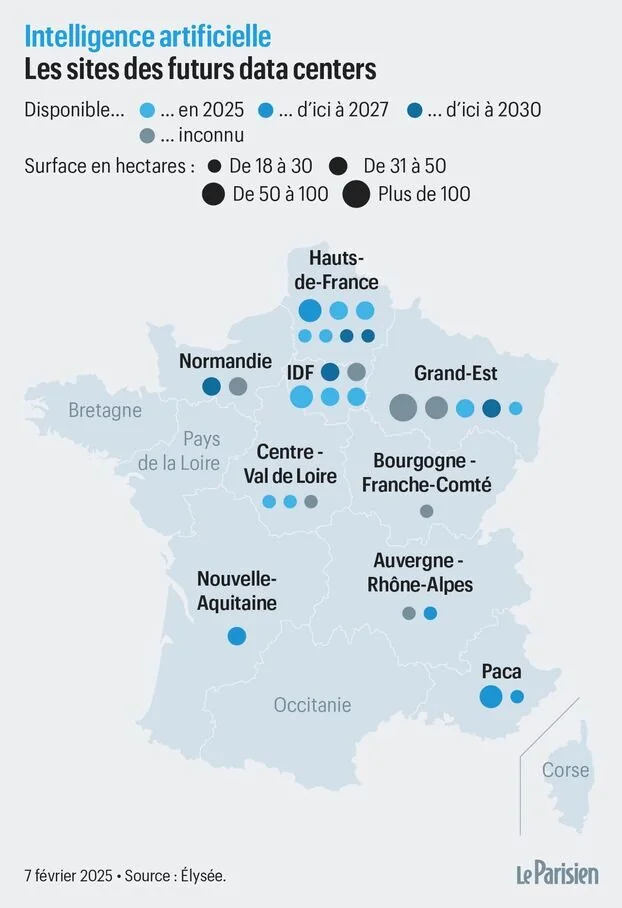
Around thirty sites announced by 2030, concentrated along the Île-de-France to Hauts-de-France axis (close to the transatlantic cables and to the Marseille interconnection hub), with a second belt in Grand Est, Auvergne-Rhône-Alpes and the Marseille region. The choice depends less on available water than on the connection to the grid operated by RTE (France's electricity transmission operator) and on industrial land. The useful question to put to an AI provider is therefore no longer "how much water per query?" but "where do your data centres run, and how are they cooled?". The local basin determines the real water pressure, not the global average.
Volumes of this size matter little in Scandinavia and a great deal in Arizona or Texas, where conflicts over water use are documented. The French think tank The Shift Project (October 2025) points to competing uses of water around the sites and recommends setting a ceiling trajectory for data centre electricity, listing the sites and their consumption and bringing the sector into France's national low-carbon strategy.
Operators respond in 2 ways. Air cooling (dry cooling) exchanges heat directly with the atmosphere, with no evaporation. It can be used anywhere, at the cost of lower thermal efficiency and higher electricity costs, and it is becoming viable as modern servers tolerate higher operating temperatures; Google has required it since 2023 for its new sites in water-stressed areas. Immersion cooling submerges the servers in a dielectric fluid, which cuts water consumption by 90% and cooling costs by 40%. The adoption of liquid cooling rises from 3% of the fleet in 2021 to a projected ~37% in 2026 on new AI sites (Data Center World 2026).
At Projet Celsius, we therefore think the useful question to put to an AI provider concerns its sites rather than water per query: "where do your data centres run, and how are they cooled?"
5Key takeaways
- A query uses a few drops of water: 0.26 mL measured by Google for Gemini and ~0.3 mL cited by Sam Altman for ChatGPT, both counting only cooling.
- The "half a litre per query" figure is a misleading shortcut: the 500 mL was for 10 to 50 GPT-3 responses, and the ~519 mL for a GPT-4 email counts total water.
- From 0.26 mL (cooling) to 45 mL (Mistral's full LCA), each published figure is accurate within its own scope, and that scope must be checked before any comparison.
- Geography decides: the same query has a small footprint in Sweden and a large one in Arizona, and the real issue is the concentration of data centres in basins that are already under strain.
- For a company, the water used by digital services is assessed in a multi-criteria LCA, because the Bilan Carbone® counts only carbon.
Water completes the picture left by energy figures. Read this article alongside the energy comparison of AI models and the carbon footprint of AI at organisation level, then carry it into an LCA (in French) as soon as your analysis of digital has to stand up to scrutiny.