
- 1Cradle-to-grave climate impact: -73% in favour of the compact BEV on the 2025 EU mix (ICCT).
- 2Battery cells: 54 to 115 kg CO2e/kWh depending on chemistry (Peiseler 2024).
- 3Mineral resources, toxicity, ecotoxicity, radiation: 4 categories where the BEV performs worse.
- 4Three variables determine the result: battery capacity, charging mix and actual total mileage.
1A compact EU BEV emits 63 g CO2e/km over its life cycle, compared with 235 g for petrol (ICCT 2025)
In July 2025, the ICCT published its updated cradle-to-grave LCA for vehicles registered in the EU in 2025: ~240,000 km over a 20-year useful life, with a projected electricity mix for 2025-2044 (JRC POTEnCIA CETO scenario, IEA STEPS for sensitivity analysis). The results for a compact-segment vehicle: petrol 235 g CO2e/km, diesel 234 g, hybrid (HEV) 188 g, plug-in hybrid (PHEV, corrected WLTP consumption) 163 g, BEV on the EU mix 63 g, BEV on 100% renewable electricity 52 g.
Life-cycle emissions by powertrain (ICCT 2025)
Cradle-to-grave scope, ~240,000 km over 20 years, electricity mix projected over the lifetime (JRC POTEnCIA CETO 2025-2044 scenario, IEA STEPS for sensitivity analysis), WLTP consumption corrected for actual use. The BEV on the EU mix emits 3.7 times less than petrol over its full life cycle.
The gap between BEVs and petrol cars comes from the efficiency of the electric powertrain (~85% plug-to-wheel compared with ~25 to 30% tank-to-wheel for a modern combustion engine) and the gradual decarbonisation of the mix.
Unrepresentative assumptions (too short a lifetime, type-approval consumption figures, an electricity mix frozen at the year of purchase) underestimate combustion-engine and hybrid vehicles by 7 to 11%, PHEVs by around 32%, and overestimate BEVs by up to 64% (ICCT 2025). Confusing well-to-wheel (use only) with cradle-to-grave (the full life cycle, including manufacturing and end of life) always undervalues electric vehicles in support of an anti-BEV narrative.
The carbon break-even mileage (the cumulative threshold at which the BEV pays back its manufacturing carbon debt): ~17,000 km on the average EU mix according to the ICCT (2025), or 1 to 2 years of average use. With manufacturing assumptions of a similar order (Ricardo 2020), our model gives around 14,000 km on the French mix, 22,000 km on the German mix and 39,000 km on the Polish mix, compared with a compact petrol car. ADEME uses much higher values, detailed below.
Over a lifetime of 200,000 km, the BEV retains a climate advantage of -37% over a petrol car even in Poland, with a battery made in China (Transport & Environment 2022). No actual EU mix produces a BEV that is worse than a petrol car over its full life cycle.
17,000 or 70,000 km? What ADEME's October 2026 opinion says
In October 2026, ADEME published a new opinion, "The electric car and its charging". For a 60 kWh compact car (430 km of type-approved range) charged in France, it concludes that the life-cycle carbon footprint is at least divided by 2 compared with a non-plug-in petrol hybrid, and 2.25 times lower after 240,000 km. The manufacturing carbon debt is paid back only after around 70,000 km.
ADEME therefore remains consistent with its 2022 opinion, which placed this point at around 70,000 km for a 60 kWh compact car, before 20,000 km for a 22 kWh city car and beyond 100,000 km for a 100 kWh battery. The ICCT, meanwhile, finds 17,000 km on the European mix.
The two figures do not answer the same question. First, the comparator: ADEME compares the electric car with a non-plug-in hybrid, the most fuel-efficient combustion-based powertrain, rather than a conventional petrol car. Then, manufacturing: with around 140 kg CO2e/kWh for a battery made in Asia, the compact electric car starts at around 16 t CO2e compared with around 7.5 t for the hybrid, according to the opinion's chart, whereas the assumptions based on Ricardo 2020 give 8.5 t. Finally, use: WLTP type-approved consumption and electricity at 46.1 g CO2e/kWh (Base Empreinte, the average mix consumed in France in 2025).
For a study, the lesson fits into one sentence: a break-even mileage can only be understood alongside its comparator and battery emission factor. The infographic below lets you switch between the two sets of assumptions.
Of the 14 impact categories assessed for the European Commission, the BEV loses out in 4: mineral resources, human toxicity, freshwater ecotoxicity and ionising radiation (Ricardo 2020).
2Methodological scope: exactly what a vehicle LCA covers
An attributional Life Cycle Assessment measures the environmental impacts of a product system across its entire cycle: extraction and refining of raw materials, manufacturing (battery cells, body, powertrain), vehicle assembly, distribution, use (charging, maintenance, tyres) and end of life (dismantling, recycling). The European framework (Recommendation 2021/2279, PEF method) requires 16 impact categories with standardised units: climate change (kg CO2 eq, IPCC AR6), mineral and metal resources (kg Sb eq), fossil resources (MJ), cancer and non-cancer human toxicity (CTUh), freshwater ecotoxicity (CTUe), particulate matter (disease incidence), ionising radiation (kBq U-235 eq), photochemical ozone formation, acidification (mol H+ eq), terrestrial/freshwater/marine eutrophication, land use, water use (m3 world eq) and ozone depletion.
Where does the BEV have an impact, category by category?
For each impact category: the verdict compared with a petrol car, indicator robustness and each vehicle subsystem's share. Filter by verdict and expand a row to read the mechanism.
Higher manufacturing impact because of the battery, use divided by 3 to 6 depending on the mix. Carbon debt paid back between ~17,000 km (ICCT, EU mix, compared with petrol) and ~70,000 km (ADEME, compared with a hybrid).
Traction battery 42%Traction electricity 22%Body and chassis 18%Powertrain 8%Running gear 6%End of life 4%
Robust: breakdown published in a primary source. Partial or Indicative: derived breakdown, interpret as a trend. Toxicity and ecotoxicity indicator robustness is rated limited by the JRC.
BEV methodological harmonisation is progressing through the Horizon Europe project TranSensus LCA (coordinated by Fraunhofer, consolidated guidelines from July 2025), which recommends: a cradle-to-grave scope, a functional unit of 200,000 km over 15 years, dynamic modelling of the electricity mix based on an official national or policy scenario (IEA STEPS only as a fallback), and certificates of origin accepted only under strict conditions (a recent installation, the same price zone or less than 500 km away, temporal matching).
Open points to acknowledge in any study published in 2026. No vehicle or "eMobility" PEFCR has been finalised; the "High Specific Energy Rechargeable Batteries" PEFCR (RECHARGE, v1.1 of February 2020) expired on 31 December 2021 and has not been revised. The CFB-EV rules under Article 7 of Regulation (EU) 2023/1542 remain in draft form (JRC, June 2023, followed by a draft delegated act submitted for consultation in April 2024): as of 7 October 2026, the delegated act due on 18 February 2024 has still not been adopted.
The automatic consequence of Article 7's "whichever is the latest" clause: the mandatory carbon footprint declaration for traction batteries, initially expected on 18 February 2025, will only become due 12 months after the act enters into force.
3Cradle-to-grave breakdown: where emissions arise in each phase
The infographic below breaks down the life-cycle emissions of a compact BEV in France (source: ADEME impactco2, 2025 modelling). For climate impact, 82% of the life-cycle footprint comes from the manufacturing phase (raw materials, battery cells, assembly) and 18% from the use phase (charging, maintenance). An equivalent compact combustion-engine car in France shows the reverse profile (~22% manufacturing, ~78% use). The strategic implication: decarbonisation of the French electricity mix shifts the BEV challenge upstream to industry - sourcing critical materials, energy for cell production and logistics.
Where does a car's carbon footprint arise?
For a BEV charged on the French mix, manufacturing accounts for 82% of the life-cycle footprint. This reverses the petrol profile, where use dominates at 78%. The climate challenge of electric mobility lies upstream in industry (extraction, cells, chassis).
Battery, use, end of life: the contribution of each phase
The battery is the focus of manufacturing impact. The 2024-2025 cradle-to-gate cell range is 54 to 115 kg CO2e/kWh (from the 5th percentile for LFP to the 95th percentile for NMC 811, probabilistic modelling by Peiseler et al. 2024, Nature Communications; medians: NMC 811 at 74 kg/kWh, LFP at 62 kg/kWh). Sodium-ion does no better at this stage: 75 to 87 kg/kWh according to Degen et al. (2025), held back by its lower energy density. For a 60 kWh pack: 3.2 to 6.9 tonnes of CO2e for cradle-to-gate cells.
This range is 2 to 3 times lower than in 2017 (150 to 200 kg CO2e/kWh, IVL 2017), thanks to lower carbon intensity in industrial electricity mixes and optimisation of dry rooms and formation. The figures of 150-200 kg/kWh still circulating in the mainstream press are outdated by a factor of 2 to 3.
Breakdown of the NMC 811 battery footprint (Peiseler 2024): materials dominate (>50% of the total, with nickel sulphate leading), rather than cell assembly. The median Europe-China gap is modest (69 vs 77 kg CO2e/kWh): upstream sourcing of critical materials matters more than the assembly location. Sea transport of cells contributes only marginally. Further reading: battery carbon footprint hotspots and levers.
ADEME's October 2026 opinion uses a higher order of magnitude, around 140 kg CO2e/kWh for a battery made in Asia: the difference from Peiseler comes from the scope (a complete battery rather than a cell) and the assumption of Asian production. This gives manufacturing emissions ranging from 8 t CO2e for a small city car (including 3.6 t for a battery with 200 km of range) to nearly 20 t for a long-range compact SUV (including 11.3 t for 650 km).
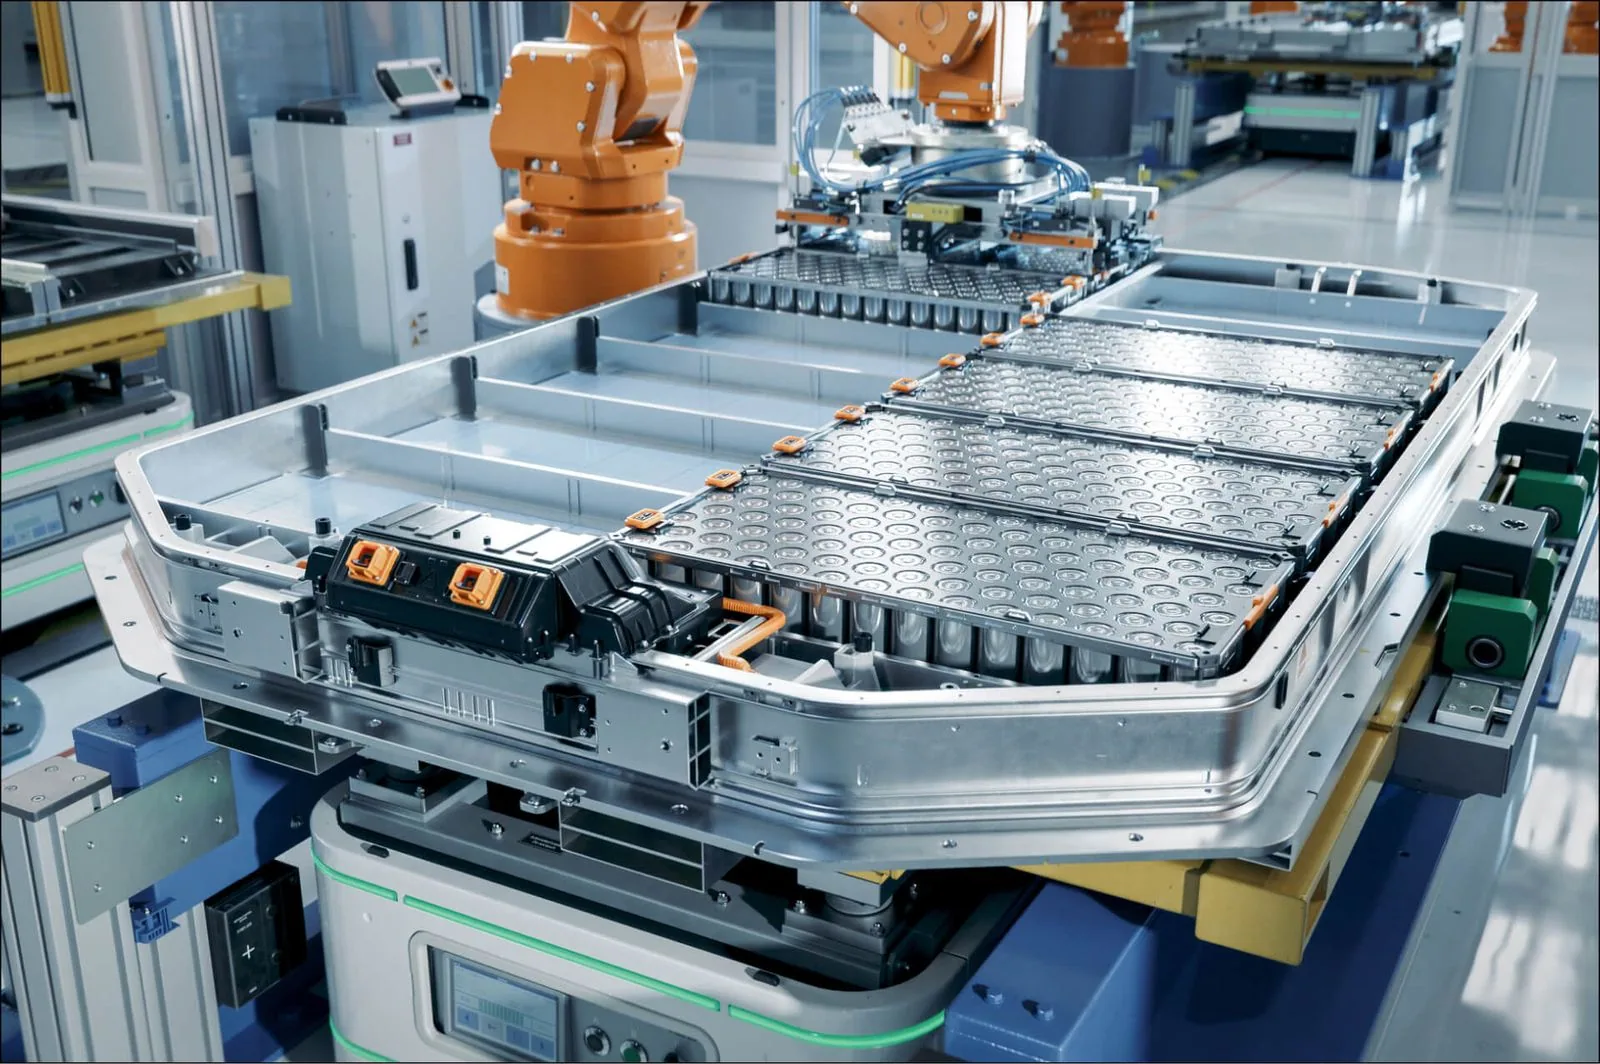
LFP reduces the footprint by around 10% compared with NMC, and moving manufacturing to a country with low-carbon electricity reduces it by 15 to 25%, but active material synthesis, accounting for 60 to 70% of the battery footprint, remains in Asia. Manufacturer-side levers are detailed in our article on industrial battery LCA.
Use depends on actual consumption measured at the socket (15.4 to 20.8 kWh/100 km depending on segment, EV Database 2026; ADAC Ecotest tests confirm +12 to +29% compared with the WLTP value, including charging losses), charging losses (10 to 30% from a 2.3 kW household socket, 5 to 10% from an 11 kW AC wallbox, 5 to 15% from fast DC charging - ADAC 2025), and above all the carbon intensity of the electricity mix at the time and place of charging.
In France, off-peak charging coincides with an almost decarbonised mix (nuclear + hydropower). The attributional/consequential methodological debate (average vs marginal mix) remains open: ADEME/RTE's position (national average mix) is consistent with PEF and TranSensus, and will be updated in 2027.
End of life contributes only marginally to vehicle LCA (Machala et al. 2025, Nature Communications: at least -58% impact for recycled cathode materials compared with virgin materials) but becomes strategic at sector level. Regulation (EU) 2023/1542 sets the Annex XII Part C thresholds: by 31 December 2027, material recovery of 50% for lithium and 90% for cobalt/copper/nickel/lead; by 31 December 2031, 80% for lithium and 95% for the others. Note: in 2026, the European sector has excess pre-processing capacity (~270 kt/year installed by mid-2025 for a supply of ~100 kt/year), owing to a lack of volume: production is rising more slowly than expected and batteries last longer (Fraunhofer ISI, July 2025).
ADEME's October 2026 opinion puts the recycling gain at 2 to 11% of the battery's total carbon footprint, depending on chemistry and factory location. It points out that France and Europe currently carry out only mechanical pre-processing, up to "black mass": cobalt, nickel and lithium extraction still takes place outside Europe, particularly in Asia.
For durability, monitored fleets show an average capacity loss of 1.7 to 2.3% per year, or around 89% residual capacity at 200,000 km, above the Euro 7 thresholds (80% at 5 years or 100,000 km, 72% at 8 years or 160,000 km). From February 2027, the battery passport will let used-car buyers access this state of health.
4Effect of the charging electricity mix: a factor of 15 to 20 between France and Poland
The carbon intensity of the charging mix changes the use phase by a factor of 15 to 20 between France and Poland, for comparable scopes. 2024 intensities in g CO2e/kWh (check the scopes): France 21.7 (RTE, direct production) or 30.2 (RTE, production LCA); Ember gives 40.5 for the life cycle using generic factors; Germany 353 (UBA, consumption); Poland 608 (Ember, life cycle); EU-27 average 211 (Ember). The 2025 data confirm the order of magnitude (RTE: 19.6 g direct, 29.0 g LCA). Sweden and Norway fall below 20 g thanks to hydropower and nuclear energy.
Carbon break-even mileage by mix and assumptions
Select the charging country: the BEV curve starts higher (manufacturing + battery) but rises more slowly. Then switch to the assumptions in ADEME's October 2026 opinion: the same crossing, but much further along.
Carbon break-even mileage for a compact 60 kWh BEV compared with a petrol car, using Ricardo 2020 manufacturing assumptions: France ~14,000 km, EU mix ~18,000 km (17,000 km according to the ICCT), Germany ~22,000 km, Poland ~39,000 km. With ADEME's assumptions (an Asian battery, comparison with a hybrid), the French threshold rises to ~70,000 km. Over a lifetime of 200,000 km or more, all these thresholds are exceeded. The only documented case in which a BEV would exceed a petrol car over its full life cycle is a theoretical 100% coal scenario (326 g/km vs 270 g for petrol, Ricardo 2020) - it does not correspond to the actual mix of any EU country.
Major methodological pitfall: freezing the electricity mix at the year of purchase. A vehicle registered in 2026 will run on the 2026-2045 mix, which will become progressively less carbon-intensive: the ICCT and TranSensus LCA therefore model a dynamic mix over the lifetime. Combined with too short a lifetime and type-approved consumption, this error can overestimate the BEV by up to 64% (ICCT 2025).
5Multiple criteria: the 4 categories where the BEV performs worse
Of the 14 impact categories assessed by Ricardo for the European Commission (2020), most of them close to those in PEF, a compact BEV on the 2020 EU mix performs worse in 4 and better or equivalently in the others (additional evidence from EEA TERM 2018 and ADEME 2013). The infographic below compares relative intensities by category, normalised to 100% for the variant with the highest impact - the standard format in comparative LCA reports.
Multi-criteria environmental profile of BEV vs combustion-engine car, 8 impact categories
The standard grouped-chart format in comparative LCA reports: within each category, the highest-impact variant equals 100%. This framing naturally absorbs differences in orders of magnitude between categories (the very large ionising radiation gap disappears from the scale) and highlights reversals in performance.
The 4 categories where the BEV performs worse
Details of the 4 unfavourable categories. Mineral and metal resources (kg Sb eq): the BEV doubles the petrol car's impact, driven mainly by copper (wiring, electric motor) and power electronics - rather than the battery's critical metals (Li/Co/Ni), as media coverage suggests. Human toxicity (CTUh): BEV production emits 2.2 to 3.3× more than combustion-engine production, with 70-75% of the gap linked to copper and nickel mining tailings. Freshwater ecotoxicity (CTUe): nickel sulphate and anode copper dominate. Ionising radiation (kBq U-235 eq): a direct effect of the nuclear share of the mix, which charging in France accentuates strongly.
Methodological cautions. The robustness of the human toxicity, freshwater ecotoxicity and mineral resource indicators is rated "limited" by the JRC in EF 3.1: these differences are indicative, rather than decision-grade. For mineral resources specifically, the ranking reverses depending on the characterisation model used: with the CML "ultimate reserves" method, ADEME 2013 found the BEV slightly more favourable than the combustion-engine car (the platinum-group metals in the latter's catalytic converter contribute heavily); with EF 3.1, the BEV performs worse.
6Effect of battery capacity: beyond 60 kWh, the climate advantage erodes
ADEME quantifies the threshold: above ~60 kWh of battery capacity, the environmental advantage "is not guaranteed", and the carbon break-even mileage of a premium SUV reaches ~100,000 km. Higher capacity affects three areas: (1) manufacturing (the battery footprint grows almost linearly with capacity, ~65 kg CO2e/kWh for a median cell), (2) use (+30% kWh/100 km consumption between a compact BEV at 15-16 kWh/100 km and a premium SUV at 20-21 kWh/100 km, source: EV Database 2026), (3) mass-related non-exhaust particulate matter.
The electric car among transport options
Switch between the use phase alone (the only figure shown by most public calculators) and the full life cycle (manufacturing + use). The gap is particularly visible for BEVs and electric bicycles, where manufacturing contributes relatively heavily.
Lithium-ion battery footprint trajectory 2017 to 2025 (a factor of 2 to 3 in 8 years)
The 2017 range (150 to 200 kg CO2e/kWh, IVL) still circulating in the press is outdated by a factor of 2 to 3 compared with 2024-2025. Progress comes from lower carbon intensity in industrial electricity mixes, optimisation of dry rooms and the scale of gigafactories.
The October 2026 opinion shifts the focus from battery size to vehicle efficiency. Type-approved consumption for models sold in France varies by a factor of two, from 12 to 24 kWh/100 km: 400 km of range therefore requires 50 to 90 kWh of battery, depending on the model. ADEME recommends choosing an efficient model and high charging power (100 kW or more) rather than a bigger battery, which costs around €10,000 more per 200 km of range and increases the manufacturing footprint.
A BEV SUV remains favourable for climate impact compared with its combustion-engine equivalent (Volvo XC40 Recharge: 45 t CO2e over its life cycle, 200,000 km on the EU-28 mix, source: Volvo 2020 report; distinguish this from the often-quoted 27 t, which corresponds to the unrepresentative 100% wind scenario); Polestar 3: 35.3 t on the European mix. But a BEV SUV performs worse than a compact BEV in every impact category. The relevant comparison for a decision is therefore not only "BEV SUV vs combustion-engine SUV" but also "BEV SUV vs compact BEV".
For non-exhaust particulate matter, the OECD (2020) gives these figures: a light BEV emits -11 to -13% non-exhaust PM2.5 compared with an equivalent combustion-engine car; a heavy (long-range) BEV emits +3 to +8% because of its greater mass. Regenerative braking greatly reduces brake particulates: Euro 7 sets a stricter limit for electric vehicles (3 mg PM10/km) than for other powertrains (7 mg PM10/km), applying to new types from 29 November 2026 and all new vehicles from 29 November 2027.
Tyre abrasion remains unresolved: ~450,000 tonnes/year of tyre-wear particles in the EU (European Commission), with an upward trend as the fleet's average mass increases.
ADEME's October 2026 opinion is more favourable than the OECD's. Drawing on measurements by Graz University of Technology (2025) and the HBEFA database (2025), it concludes that reduced brake wear offsets the additional tyre and road abrasion, with non-exhaust emissions divided by 2 for PM10 and reduced by more than a third for PM2.5 in mixed use in France. The two assessments cover different data and vehicle sizes: for a heavy model, the OECD's caution still applies.
The carbon orders of magnitude of other modes complete the comparison.
Even when electric, the private car remains around 6 times more carbon-intensive per passenger.km than an e-bike and 20 times more than the TGV: BEV in France ~67 g CO2e/passenger.km including manufacturing vs ~3 g for the TGV, ~11 g for an e-bike (source: ADEME impactco2, assumptions: 1 passenger, aviation excludes contrails). Electrifying the fleet does not replace using lower-impact modes or shifting to rail and active travel.
7Key takeaways
- For climate impact (GWP100 IPCC AR6), cradle-to-grave LCA gives -73% in favour of the BEV on the 2025 EU mix (ICCT, ~240,000 km), with carbon break-even mileage of ~17,000 km on the EU mix. With an Asian battery and compared with a petrol hybrid, ADEME's October 2026 opinion uses around 70,000 km for a 60 kWh compact car, as in 2022.
- Cradle-to-gate battery cell manufacturing: 54 to 115 kg CO2e/kWh depending on chemistry (Peiseler et al. 2024, probabilistic modelling), a range reduced by a factor of 2 to 3 since 2017 (150-200 kg/kWh, IVL 2017). A 60 kWh pack = 3.2 to 6.9 t CO2e.
- Of the 14 categories assessed for the European Commission (Ricardo 2020), the BEV performs worse in 4: mineral resources, human toxicity, freshwater ecotoxicity and ionising radiation (accentuated by the French nuclear mix). Toxicity and ecotoxicity robustness is rated limited by the JRC.
- Three variables determine the life-cycle result: battery capacity and model efficiency (beyond ~60 kWh, the climate advantage erodes according to ADEME in 2022; consumption ranges from 12 to 24 kWh/100 km depending on the model in 2026), carbon intensity of the charging mix (a factor of 15 to 20 between France and Poland) and actual total mileage.
- The relevant comparison for a decision is not only "BEV vs combustion-engine car" but also "which BEV": a BEV SUV remains worse than a compact BEV in all impact categories.
- Electrifying the fleet does not replace using lower-impact modes: ~67 g CO2e/passenger.km for a BEV in France vs ~3 g for the TGV and ~11 g for an e-bike (ADEME impactco2).