
- 1The Bitcoin network uses 138 TWh of electricity a year because of Proof of Work, its computation-based validation mechanism, and emits nearly 40 MtCO2e.
- 2Bitcoin emits about 33 tonnes of CO2 per million euros held, five times less than the euro fund of a French life insurance policy.
- 3Ethereum emits 10,000 times less than Bitcoin since the Merge (2022), its move to Proof of Stake, which replaces computation with a locked-up stake.
- 4A low carbon intensity does not make an asset virtuous: crypto does not finance any part of the transition.
Holding cryptocurrencies has a climate impact, but protocols differ so widely that it makes no sense to treat "crypto" as a single block. Bitcoin alone accounts for more than 95% of the emissions of the crypto market and emits about 33 tonnes of CO2 per million euros held, whereas Ethereum has emitted 10,000 times less per euro invested since 2022. The difference comes down to the consensus mechanism, the way a network validates transactions.
Carbon footprint of the leading cryptocurrencies
Emissions intensity, in tonnes of CO₂ equivalent per million euros invested. Tap a cryptocurrency for its consensus details.
Bitcoin relies on Proof of Work, a validation system based on computation that uses a great deal of energy. Ethereum moved to Proof of Stake in 2022, and Solana, Cardano and Polygon have used it since they launched; this mechanism uses tens of thousands of times less electricity. Other cryptocurrencies, such as Litecoin, Dogecoin and Bitcoin Cash, remain on Proof of Work. The sections below set out the figures and show how to include these assets in a Bilan Carbone® (the French carbon accounting method).
1Why Bitcoin emits so much CO2: mining and the electricity mix
Bitcoin's footprint comes not from "blockchain" technology as such but from the way its network secures itself: a permanent, worldwide race for computing power.
Mining: computation, and therefore electricity
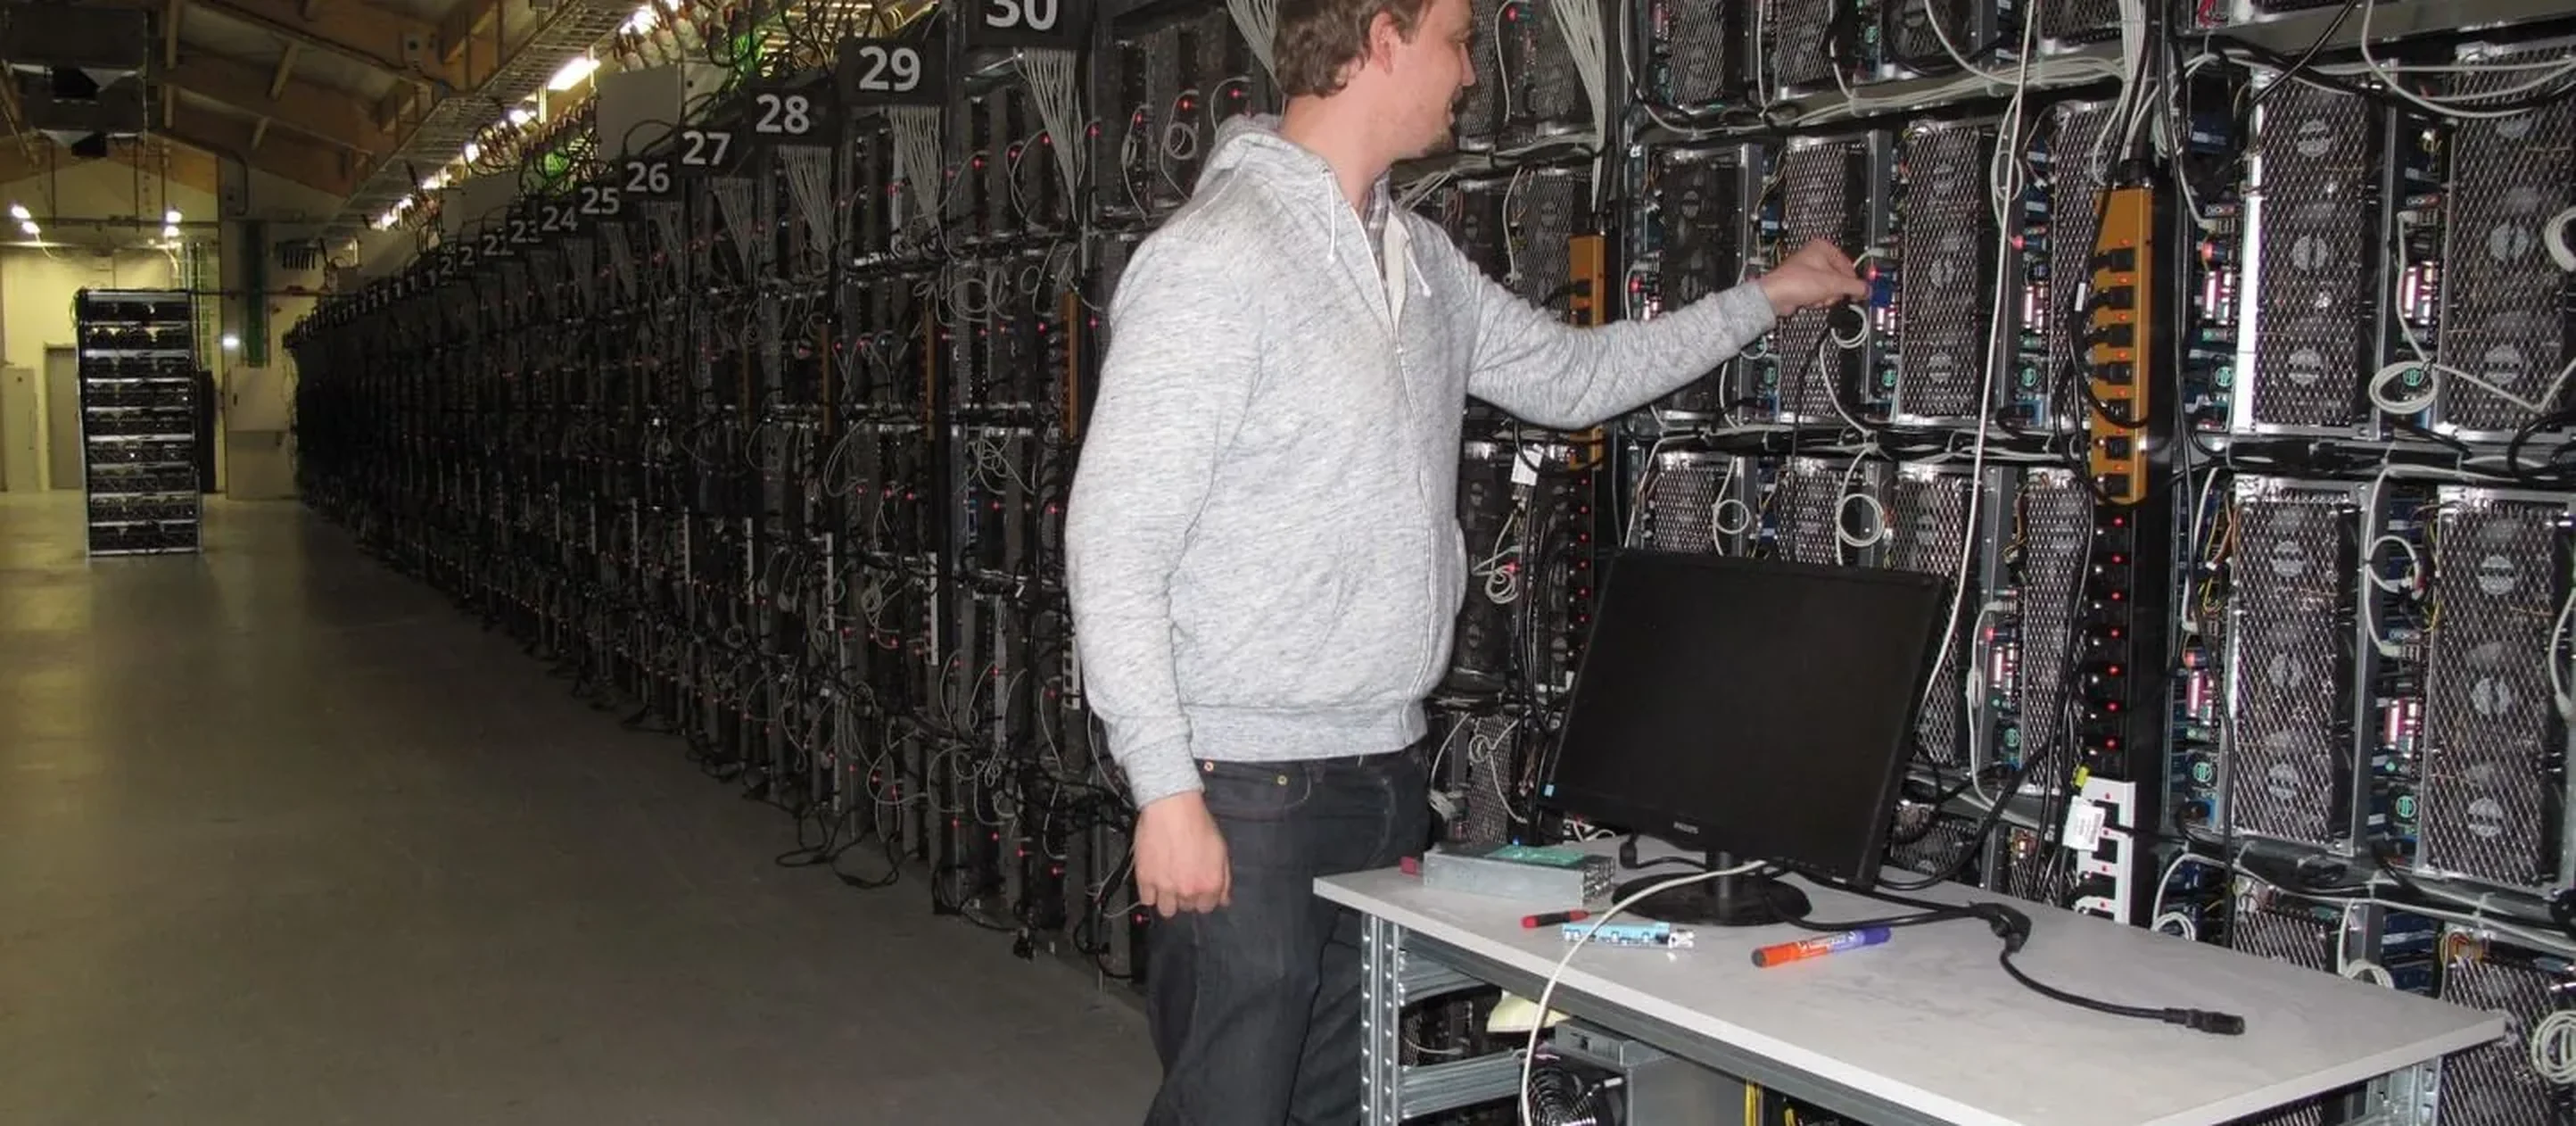
Bitcoin works through competitive mining. To add a block of transactions to the chain, which happens every 10 minutes, specialised machines test billions of combinations until one of them validates the block. As the network's total computing power grows, the protocol automatically raises the difficulty to maintain that pace. Electricity consumption therefore rises with adoption, by design. Unlike a bank payment, the energy is not spent on processing the transaction itself: it deters fraud by making any attack prohibitively expensive.
138 TWh a year, as much electricity as Poland
The Cambridge Bitcoin Electricity Consumption Index (CBECI), the standard academic source on the subject, puts the network's consumption at 138 TWh in 2024, or 0.5% of the world's electricity, equivalent to the consumption of a country such as Poland. With about 19.7 million bitcoins in circulation, that comes to about 2 tonnes of CO2 per bitcoin per year. Most of this consumption does not depend on the number of transactions: it comes from the permanent competition between miners to secure the network, so adding transactions changes the energy bill very little.
From kWh to CO2: the role of the electricity mix
What this consumption emits depends on the electricity mix of the regions where the mining farms are located: mainly Texas (gas) and Kazakhstan (coal), plus Russia (gas), with a few pockets of hydropower (Paraguay) or geothermal energy (Iceland). The Cambridge Digital Mining Industry Report 2025 puts the network's emissions at 39.8 million tonnes of CO2 in 2024, as much as Portugal emits.
This dependence on fossil fuels is no accident: mining is mobile and sets up wherever electricity is cheapest, often from surplus gas or coal. Some supporters see it as a way of making use of "stranded" energy, but in practice most mining remains connected to carbon-intensive grids.
The Bitcoin network uses as much electricity as Poland, for a single currency.
2Bitcoin vs Ethereum: a 10,000-fold gap
This is the most striking gap in the whole sector, and it is due entirely to the consensus mechanism.
Why Bitcoin consumes 100 times more than Ethereum
Two ways of securing a blockchain network for the same function. The choice of consensus mechanism makes all the difference to the footprint. Hover over each column to compare.
- 1Thousands of miners compete.
- 2Each machine tests billions of combinations per second.
- 3The first to find the key validates the block and collects the reward.
Security comes from the cumulative electricity cost of mining: the network cannot be attacked without owning half of the world's computing power.
- 1Each validator locks up 32 ETH (~ €80,000) as collateral.
- 2The protocol selects a validator at random for each block.
- 3The validator signs the block. There is no computing competition.
Security comes from the stake posted as collateral: a dishonest validator loses its 32 ETH. Raw computing power is no longer needed.
The Merge: Ethereum switches to Proof of Stake and cuts energy use by 99.95%
In September 2022, Ethereum switched from Proof of Work to Proof of Stake in a change known as the Merge. Validators no longer compete on computing power: each locks up a stake as collateral (32 ETH, or about €80,000) and is chosen at random to validate blocks. Energy use fell by 99.95%, from about 80 TWh a year to a few GWh, roughly what a small village consumes, on what is the world's second-largest blockchain.
Other protocols and stablecoins
The other major protocols (Solana, Cardano, Avalanche, Polygon) are natively Proof of Stake, with intensities of the same order as Ethereum's. Stablecoins (USDC, USDT, DAI) are tokens issued on these chains, so their footprint is that of the host chain and is negligible next to Bitcoin's.
What matters most is the consensus mechanism, not the blockchain itself: Proof of Work or Proof of Stake.
3Carbon intensity per euro invested: Bitcoin against conventional investments
To compare crypto with other investments, these emissions are expressed as an intensity: the quantity of CO2 per million euros held per year, the unit used for all investments (in French) (in French).
How much CO₂ for €10,000 in crypto?
Choose an amount and a cryptocurrency: the calculator gives the annual attributed emissions, in car and Paris-New York flight equivalents.
Bitcoin network: 138 TWh/year, 39.8 MtCO₂e/year (Cambridge CBECI 2024). Mining still relies mostly on coal and gas in some regions.
Bitcoin at ~33 tCO2e/€M: more than a Livret A, less than a euro fund
Measured against the average market capitalisation in 2024 (the total value of the bitcoins in circulation, about €1,200 billion), Bitcoin has an intensity of about 33 tonnes of CO2 per million euros held per year. That is about 30% more than a Livret A (France's regulated savings account, at about 25), 5 times less than a euro fund (the capital-guaranteed fund of a French life insurance policy, at about 175) and about 100 times less than holding an ArcelorMittal share directly. This is an order of magnitude rather than a measurement: it moves with the price, the electricity mix used for mining and the network's computing power.
To give a sense of scale, €10,000 in bitcoin corresponds to about 0.33 tonnes of CO2 a year, or roughly 1,700 km by car, while the same €10,000 in ether comes to a few grams of CO2. The two differ by orders of magnitude.
Calculator: the footprint of the amount you hold
The calculator below converts these intensities into a footprint for a given amount and a chosen cryptocurrency, so that you can compare Bitcoin and Ethereum with each other and with conventional investments.
4How do you count crypto assets in a Bilan Carbone®?
Individuals and companies that hold crypto assets face the question of how to report (in French) the associated emissions, and the reference method is not yet settled.
The PCAF standard does not yet cover crypto assets: the energy method in 4 steps
The PCAF (in French) method (Partnership for Carbon Accounting Financials), the standard for financed emissions, does not yet explicitly cover crypto assets: its 2024 edition lists the asset class as still to be developed. In the meantime, professional practice relies on an energy-based approach, which differs from the logic of a conventional Bilan Carbone® and has four steps:
- Step 1: estimate the network's electricity consumption (in TWh a year), using the Cambridge CBECI for Bitcoin and the foundations' reports for other protocols.
- Step 2: multiply by the emission factor of the electricity mix concerned (about 290 gCO2e/kWh for Bitcoin mining, according to Cambridge 2024; the local mix for Proof of Stake nodes, from about 50 gCO2e/kWh in France to 500 or more in the United States).
- Step 3: divide by total market capitalisation to obtain an average intensity (tonnes of CO2 per million euros).
- Step 4: multiply by the amount held to estimate the emissions attributed to you each year.
Limitations: marginal vs average effect, hodlers vs traders
This method remains imperfect. It attributes the same emissions to a very active trader and to a long-term holder (a "hodler"), and it is calculated on an average basis, whereas mining would probably carry on without your individual purchase (the marginal effect is smaller than the average effect).
It is nonetheless the most defensible approach today, and the one taken by the ESG providers (Carbone 4, a French climate consultancy, and MSCI) that are starting to include crypto assets in their reporting. The choice between marginal and average effect is not merely theoretical: on a marginal basis (the emissions that your purchase adds in practice), the footprint of a small holder is almost zero; on an average basis (the share of the network you hold), it is very real. In the absence of a consensus, the rigorous course is to publish the method chosen and apply it consistently from one year to the next.

5Carbon intensity versus usefulness for the climate: a low footprint is not enough
The figures above can be misleading. Bitcoin emits 5 times less per million euros than a French euro fund, and Ethereum has a near-zero intensity. That does not make either of them a "green" investment, and it is the most important point in this guide.
A low intensity does not make an asset virtuous
Carbon intensity measures a footprint, not a contribution to the transition. ArcelorMittal's high intensity comes with a concrete industrial decarbonisation pathway (low-carbon steel made with hydrogen), which a speculative cryptocurrency will never offer, so a low-carbon holding can be entirely useless to the climate.
Bitcoin: a non-negligible intensity and no usefulness for the transition
- Bitcoin and most cryptocurrencies are speculative assets: they finance almost no real transition project (no housing, no low-carbon grid, no transport infrastructure). The money feeds market liquidity rather than the real economy of decarbonisation.
- Ethereum and the other Proof of Stake protocols have a very low footprint, but the same reasoning applies: a blockchain does not in itself contribute to the transition, and the low-carbon projects that run on it remain marginal next to the bulk of speculative uses: decentralised finance, non-fungible tokens (NFTs) and tokens with no real use.
- Bitcoin combines both flaws: a non-negligible intensity (about 33 tCO2e/€M, above a Livret A) and almost no usefulness for the climate. A qualitative indicator such as Carbone 4's Carbon Impact Analytics (CIA), or alignment with the Science Based Targets initiative (SBTi), would rate it very unfavourably.
The conclusion holds for all asset classes, and even more so for crypto: carbon intensity alone is not a sufficient indicator. A qualitative analysis (CIA, SBTi alignment, real contribution, social impact) must always complement the measurement. For wealth advisers and family offices, this is a point to set out explicitly in the investment management mandate.
Carbon footprint per euro invested: crypto and conventional investments
In tCO₂e/€M per year. A logarithmic scale makes a factor of 1,000,000 comparable.
6Key takeaways
- Bitcoin emits about 33 tonnes of CO2 per million euros held per year: about 30% more than a French Livret A, 5 times less than a French life insurance euro fund, and about 100 times less than holding an ArcelorMittal share directly.
- Ethereum emits about 0.003 tonnes per million euros, a factor of 10,000 below Bitcoin. All the major recent protocols use Proof of Stake and have intensities of the same order.
- The deciding factor is the consensus mechanism (Proof of Work versus Proof of Stake), not the blockchain itself.
- For a Bilan Carbone®, crypto assets are included using the energy method until PCAF has published its framework, and always complemented by a qualitative indicator: intensity alone seriously understates how useless a speculative asset is for the climate.
We support wealth management advisers, family offices and institutional investors who need to include a crypto exposure in their climate reporting (under the Corporate Sustainability Reporting Directive, CSRD, or the Sustainable Finance Disclosure Regulation, SFDR) with the methodological framing and the auditable documentation, through to reducing this footprint (in French). For the standard method on equities and bonds, see our guide to PCAF financed emissions (in French). To compare with another digital energy use, our analysis of the energy use of a ChatGPT query and our comparison of which AI uses the least energy shed light on the same orders of magnitude as our article on the place of AI in the Bilan Carbone® does.