
- 1Every investment emits CO₂: it finances real activities that emit.
- 2A euro fund emits ~175 tonnes of CO₂ per million euros invested; Livret A considerably less.
- 3Life insurance is the priority lever: nearly €2,000 billion in assets, the bulk of French wealth.
- 4Low intensity does not make an investment virtuous: combine intensity, exclusions and alignment.
You probably have a Livret A, perhaps life insurance and some shares. Like many savers, you may wonder whether this money "sleeps" peacefully in an account or has a climate impact somewhere.
How much CO₂ for €10,000 invested?
Choose an amount and an investment option: the calculator gives financed emissions, in car equivalents and days of an average French person's footprint.
Investment mainly used by the CDC to finance social housing and local authorities' ecological transition. Relatively low intensity.
It does, and the difference between investments is considerable. Life insurance in a euro fund comes to around 175 tonnes of CO₂ per million euros invested per year, while Livret A is considerably lower. The real question is therefore not "do my savings emit?", but "how much, and how can I reduce it?". We begin with the simplest point: why an investment emits.
1Why your savings have a carbon footprint
An investment is not a sum waiting on a shelf. Once entrusted to a bank, insurer or broker, the money is lent or invested in real activities. These activities emit greenhouse gases, rather than the account where your money is recorded.
Your money does not sleep: it finances
Depending on the investment, your euro goes to very different destinations:
- Livret A mainly finances social housing, thermal renovation of public buildings and long-term infrastructure (water, transport, hospitals). These projects consume concrete, steel and energy: they emit.
- A share or equity fund makes you a shareholder in listed companies (NVIDIA, TotalEnergies, L'Oréal...). Holding 1% of a company means being allocated 1% of its annual emissions.
- A bond lends money to a state or company to finance its expenditure and investments, which in turn emit.
In other words, an investment's carbon footprint is simply a reflection of what it finances. This is precisely the logic of the "financed emissions" category in a bank's Bilan Carbone®, simply viewed from your statement rather than its own.
How it is measured: CO₂ per euro invested
To compare investments of very different sizes, specialists express everything in a common unit: tonnes of CO₂ (actually CO₂ equivalent, to include all greenhouse gases) per million euros invested per year. It is written tCO₂e/M€/year. This is the same unit used to measure a company's scope 3, what every Bilan Carbone® seeks to quantify.
You do not need a million euros for this to mean something to you; it is a simple proportional calculation. At an intensity of 175 tCO2e/M€, that of a euro fund, €10,000 invested accounts for around 1.75 tonnes of CO₂ per year. The calculator below performs this calculation for your amount and each investment type.
2Livret A, life insurance, shares: how much does each emit?
Now that we know where the footprint comes from, here are the 2024 indicative figures, from the lowest-carbon to the heaviest. Each family is explained along the way: you do not need to be a finance expert to follow.
Carbon footprint of retail investments
In tonnes of CO₂ per million euros invested per year (tCO₂e/M€), 2024 data. Tap a row to see what this investment option finances.
Regulated savings: Livret A, LDDS, LEP
Livret A, LDDS (Livret de Développement Durable et Solidaire) and LEP (Livret d'Épargne Populaire) form what are known as "regulated" savings. A large share of your deposits is centralised by the Caisse des Dépôts, which uses them to finance social housing and long-term infrastructure. The result: one of the lowest footprints among retail investments, with a tax-free return of 1.7% since 1 August 2026 (2.5% for LEP).
Life insurance in euro funds (~175 tCO₂e/M€)
The euro fund is the "risk-free" life insurance investment option, whose capital is guaranteed. To maintain it, insurers (CNP, Crédit Agricole, AXA) mainly buy sovereign and corporate bonds, plus a small allocation to shares.
As this basket reflects the real French and European economy (including a share of oil, gas, cement and steel), its footprint rises to ~175 tCO₂e/M€/year according to Carbone 4. Some euro funds bearing the Greenfin label fall to around 80, but remain a minority.
Shares: PEA, ETF, MSCI World (~120-140 tCO₂e/M€)
Buying shares means holding stakes in listed companies, directly or through a basket. A PEA is the French tax wrapper for doing this; an ETF (Exchange Traded Fund, or "tracker") is a fund automatically replicating a stock market index, at very low cost.
Everything depends on what the basket contains. A CAC 40 PEA reflects industrial France (~140 tCO₂e/M€; TotalEnergies alone accounts for 8% of the index). A global MSCI World ETF, driven by US technology giants, falls to around 120. Its filtered MSCI World Climate Paris Aligned version, excluding coal, oil and weapons, falls to ~40: three times lower, with almost identical diversification.
Property: SCPIs (~70 tCO₂e/M€)
SCPIs (Sociétés Civiles de Placement Immobilier) invest in property, mainly offices. Their footprint, around ~70 tCO₂e/M€/year, covers construction and operation of the buildings held. It varies greatly by portfolio: a new building meeting RE2020 standards has a much lower impact than an older one needing renovation.
For the same euro invested, the footprint of life insurance in a euro fund is far heavier than that of Livret A.
The calculator: your footprint according to your amount
To move from these averages to your situation, the calculator below translates each intensity into kilos of CO₂ according to the amount you hold, with meaningful equivalents: kilometres by car, days of an average French person's footprint. This helps place each of your investments in context.
3Where does your money actually go?
These figures are only a summary. To understand what they mean, you must examine what each family actually finances: this is where pleasant and unpleasant surprises hide.
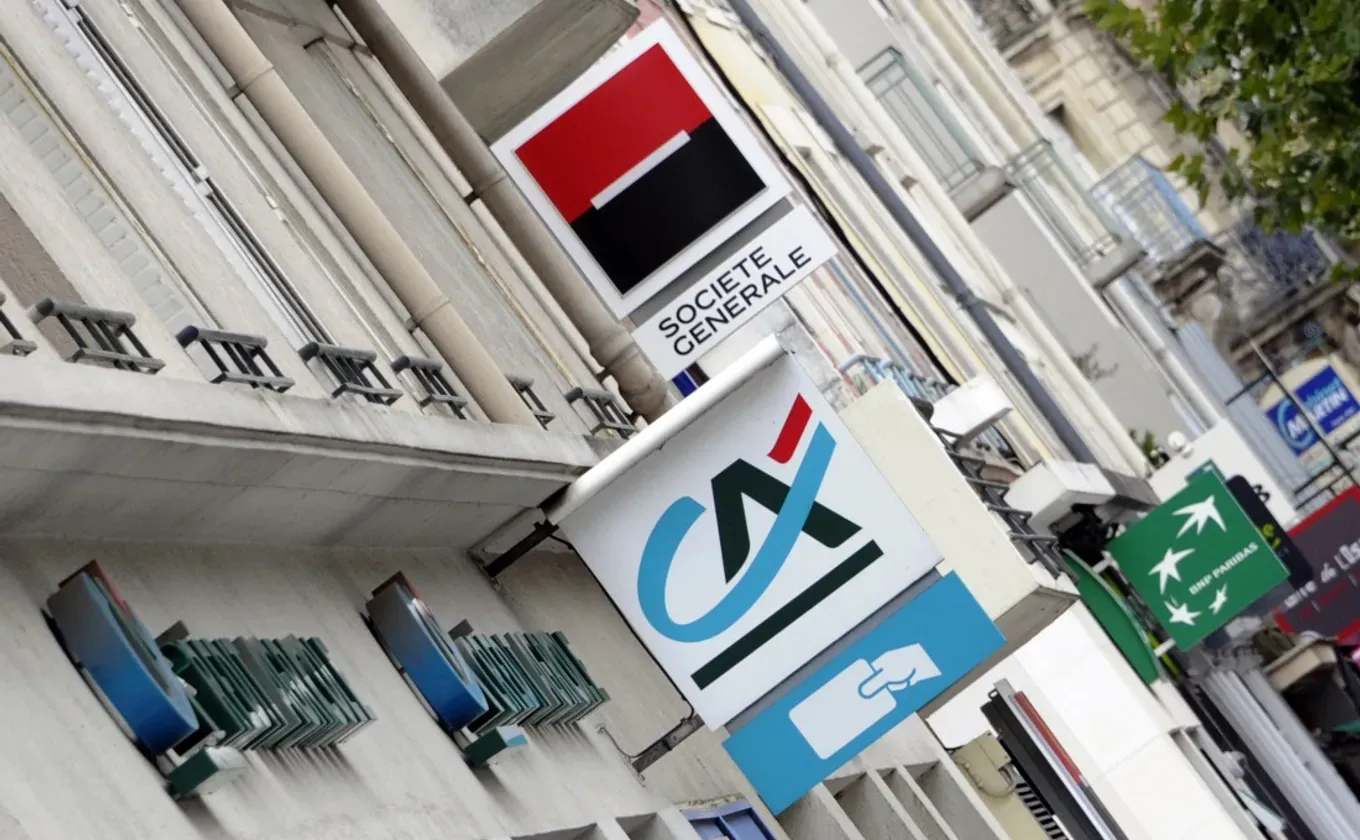
What the 6 major French banks finance
Greenhouse gas emissions linked to French banks' loans and investments, in millions of tonnes of CO₂ equivalent per year (2020).
CO₂ emitted by companies and projects the bank finances through its loans and investments (including oil, gas, coal, heavy industry). This is the footprint it causes.
CO₂ avoided through transition-focused financing (renewables, thermal renovation, low-carbon mobility). This is what it helps avoid.
Reading: through its loans and investments, BNP Paribas finances the equivalent of 749 million tonnes of CO₂ emitted each year - nearly 1.5 times France's total footprint (≈ 400 MtCO₂e). Against this, green financing avoids 38 MtCO₂e.
These figures explain why choosing the bank holding your savings matters as much as choosing the investment option. For the manager's calculation method, see our article financed emissions and the PCAF standard.
Regulated savings: social housing and infrastructure
The Caisse des Dépôts publishes the details annually. Around 57% of centralised sums go to social housing and thermal renovation, ~25% to infrastructure (water, clean transport, public facilities), with the rest going to various long-term loans. This is the investment most directly aligned with the transition, and most useful to the community for its cost.
The euro fund: the real economy, including fossil fuels
Conversely, the euro fund is the most opaque. Behind its sovereign and corporate bonds lies a sample of the whole economy: energy companies, cement makers, steelmakers. This explains its high footprint. And since it accounts for the bulk of French people's financial wealth, it is where the first decarbonisation lever lies.
Shares: the most direct lever
Paradoxically, shares give you the most control. Moving from a conventional MSCI World ETF to its Climate Paris Aligned version divides the footprint by 3 without giving up global diversification or, historically, performance. No other retail investment offers such a simple lever. Cryptocurrencies follow a separate logic, covered in a dedicated guide.

4How can you make your savings lower-carbon?
Beyond the ISR and Greenfin labels (useful but far from sufficient, and now regulated against greenwashing), here are 4 concrete criteria for judging an investment's carbon reality. This is the most technical part of the guide: it gives you the exact vocabulary to look for in a fund's documentation.
4 criteria for assessing a fund's footprint
Before choosing a listed investment option, these 4 indicators are published and comparable. Tap each criterion to understand it.
1. Look at the published carbon intensity
Since 2023, the European SFDR has required asset managers with more than 500 employees to publish their investments' principal adverse impacts (PAIs), including the carbon intensity of companies held (an indicator close to WACI, Weighted Average Carbon Intensity), and funds considering these impacts to report on them. Look for the manager's "PAI report" and, for an "Article 8" or "Article 9" fund, its periodic report, following the same transparency logic as companies' CSRD reporting. A simple benchmark: below 50 tCO₂e/M€ is very low-carbon; above 150 puts you at the higher end of the market average.
2. Check the portfolio's SBTi alignment
The "% of the portfolio aligned with SBTi" (Science Based Targets initiative) ratio indicates how many companies held have a validated reduction target on a 1.5°C or 2°C trajectory. A good climate ETF targets 100% by 2030. This signals real corporate commitment, rather than just intensity at a given moment.
3. The sector exclusions that matter
A genuinely low-carbon investment excludes at least thermal coal, tar sands, controversial weapons and tobacco. "Paris Aligned" versions add new oil and gas developments. Read the fund's exclusion policy: this is often where its seriousness shows, and it is also an area closely scrutinised for greenwashing.
4. Implied Temperature Rise (ITR), the indicator in °C
The most meaningful indicator comes last: ITR (Implied Temperature Rise) translates the entire portfolio into degrees. It asks: if the whole economy emitted at the pace of the companies you hold, what temperature would we end up at in 2100? A conventional MSCI World comes to around 2.7°C, a Paris Aligned version around 1.5 to 1.8°C.
A green bond issued by an oil company can show zero emissions while still financing the issuer.
5Key takeaways
- Every investment emits CO₂, with large differences between Livret A and the average euro fund (~175). Regulated savings remain the lowest-carbon by their very nature.
- Life insurance in euro funds is the priority lever: with nearly €2,000 billion in assets, it represents the bulk of French people's wealth and the heaviest investment.
- For shares, the lever is simple: moving from MSCI World to MSCI World Climate Paris Aligned divides the footprint by 3.
- Low intensity is not enough. An oil company's green bond can show zero emissions while supporting the issuer overall. Combine intensity, exclusions, SBTi alignment and ITR.
For an individual, the objective is not to sell everything overnight, but to know where the money goes and direct future contributions to lower-carbon options. For wealth management advisers, these indicative figures give ESG advice to clients an objective basis. For the full professional methodology, see the PCAF financed emissions guide, which extends this topic to financial institutions. Celsius supports companies and investors in measuring and reducing this footprint.