
- 1Financed emissions (the CO₂ from what an investment finances) often exceed 99% of a financial organisation's Bilan Carbone®.
- 2PCAF allocates emissions proportionally to EVIC (market capitalisation + debt): owning 10% of a company means carrying 10% of its emissions.
- 3Double counting is normal once scope 3 is included: a feature, rather than a bug.
- 4Low intensity does not make an investment virtuous: cross-reference CIA, SBTi, CDP and ITR.
When a financial organisation publishes its Bilan Carbone®, one source outweighs all others: financed emissions, meaning the greenhouse gases of the companies and projects its investments finance. For a bank, insurer or asset manager, they often represent more than 99% of the total footprint: according to CDP, an institution's financed emissions are on average 700 times higher than its direct emissions.
Carbon intensity by sector, in tCO₂e per million euros invested
For €1 million invested, the annual allocated footprint ranges from 8 to 3,000 tCO₂e depending on the sector of the company held. Hover over a row to see what drives intensity.
The reference method for quantifying them is called PCAF. The principle fits in one line: the investor is allocated the share of the issuer's emissions corresponding to its share of financing. Here is how it works, what it enables and what it does not tell you.
1Why a financial investment emits CO₂
An investment does not emit by itself. It emits because the money invested finances real activities that consume energy and materials. A portfolio’s footprint therefore simply reflects what it finances, exactly as with retail investments, but from the manager’s perspective.

The mechanism: financing means emitting
Owning part of a company or lending it money supports its activity. PCAF's accounting logic draws the direct consequence: a fraction of the company's emissions is allocated to you, in proportion to what you finance.
The 3 typical cases: savings, equities, bonds
- Savings and loans: the money finances housing, infrastructure and local projects that use materials, energy and transport, and therefore emit.
- Shares in a listed company (NVIDIA, TotalEnergies, EDF...): the company emits through its operations. Owning 10% of its total value means being allocated 10% of its annual emissions.
- Government or corporate bonds: debt finances investments (infrastructure, industrial projects and public spending) that in turn emit.
The exception: currencies, outside the scope
Not everything enters the calculation. Investments in currencies (foreign exchange, speculation on rates) are not linked to concrete emitting activities: they therefore fall outside PCAF’s scope.
For a bank or asset manager, financed emissions often exceed 99% of the total Bilan Carbone®.
2The principle: allocating emissions proportionally
The logic shared by all these cases fits in one sentence: each provider of finance is allocated the share of the issuer's emissions corresponding to its share of financing. PCAF formalises this simple rule with a rigorous formula.

The formula: amount invested ÷ EVIC × emissions
An example: if you hold €1 million in shares in a company with an EVIC of €100 billion, you finance 0.001% of the company, and 0.001% of its emissions are allocated to you. EVIC moves with markets: with unchanged emissions, the same amount invested allocates less CO₂ when market capitalisation rises. This is a denominator effect to keep in mind from year to year.
PCAF, the standard that formalises the method
PCAF (Partnership for Carbon Accounting Financials) is the reference standard recognised by the main frameworks: TCFD, ISSB, SFDR and CSRD. It connects directly with scope 3 category 15 of the GHG Protocol, investments. In practice, a manager wanting to document its financial scope 3 applies PCAF.
The 7 asset classes covered
PCAF is not limited to equities. The standard covers 7 major asset classes, each with its own adapted allocation formula:
The PCAF allocation formula for financed emissions
How a portfolio share becomes a quantity of CO₂. Vary the amount held to see the mechanism live.
- Listed equities and bonds: allocation through EVIC, the best-documented case.
- Business loans and unlisted equity: loans to companies and unlisted private equity holdings, in a single combined class. Denominator: enterprise value or amount lent.
- Project finance: allocation in proportion to project financing.
- Commercial real estate: offices, retail and logistics financed directly. Based on the property’s value.
- Residential mortgages: property loans to individuals. A separate class from offices, based on the dwelling’s energy consumption.
- Motor vehicle loans: according to use-phase emissions of the vehicles financed.
- Sovereign debt: based on the issuing state’s emissions.

3Scope 1, 2, 3: which emissions data should you use?
The formula is simple; the real issue is the emissions figure fed into it. Here, the selected scope changes the entire result.
Why scope 3 changes everything
Scope 1+2 covers only the company’s direct emissions and energy. Scope 3 adds the entire value chain (purchases, product use and end of life), which often accounts for most emissions. For an oil company, ignoring scope 3 means forgetting combustion of the fuel sold: intensity can be divided by ten. PCAF now recommends scope 1+2+3 as data become available, while scope 3 is gradually becoming mandatory.
The market-based pitfall (green electricity)
Take care with scope 2 data. The market-based method allows a company to deduct its green electricity purchases (certificates, PPAs), which can artificially reduce its scope 1+2 without its physical emissions changing. For comparing sectors, location-based scope 1+2+3 remains more robust. This is a familiar methodological difference between GHG Protocol and Bilan Carbone®.
The 7 PCAF asset classes and their allocation basis
Each portfolio holding follows its own allocation rule. Open a class for details.
4Double counting: a false problem, a real debate
A legitimate first reaction to PCAF is: "Is there not double counting?" The answer is yes, and it is normal.
Investor / company double counting: normal and intentional
If you own 10% of NVIDIA, 10% of its emissions are allocated to you, and those same emissions also appear in NVIDIA’s Bilan Carbone®. It is the same mechanism as an ordinary company’s scope 3: capturing a panoramic view of all direct and indirect opportunities for action, even if an emission is counted at several points in the chain.
Double counting within a portfolio: the two approaches
A second case arises within the portfolio itself: if it contains both TotalEnergies (which produces gas) and a customer company (which consumes it), the same molecules are counted twice. Two schools of thought can be defended:
- Limit analysis to scope 1+2: simplifies collection and largely neutralises double counting. This is the historical approach, still very widespread.
- Accept double counting by including scope 1+2+3: the approach recommended by PCAF as scope 3 data become more widespread. Double counting becomes a normal methodological feature.

5Carbon intensity: what the figures do not tell you
Estimating financial emissions is an excellent habit: this source is often underestimated or even ignored for lack of data, although it may represent most of a financial organisation’s footprint. But quantitative measurement is not enough to say whether an investment is virtuous.
Estimate your investment’s GHG emissions
Service tech (NVIDIA, Microsoft, Meta, Alphabet, Apple): low own footprint, data centres as the main electricity source. Location-based estimate (actual grid mix), without gaming green electricity certificates that artificially lower market-based emissions. Scope 3 dominated by suppliers and use.
Intensity used: 8 tCO₂e/€million invested
The sector spread: a factor of around 400
The gap between sectors is enormous. Across the calculator’s 6 typical companies, intensity ranges from ~8 tCO₂e/€million for service technology to ~3,000 for oil, a factor of around 400. This sector gap, far more than the amount invested, determines a portfolio’s footprint. The spread summarises the reality better than scope 1+2 figures alone, which are often distorted by market-based green electricity. The interactive calculator below quantifies the footprint allocated for these 6 typical companies according to the amount held.
Why low intensity does not make an investment virtuous
- A technology company, with naturally low intensity, reports a few dozen tCO₂e/€million. But its usefulness for the transition remains debatable.
- A major projects company such as Grand Paris is inherently more intensive (several hundred tCO₂e/€million), while financing public transport and active and sustainable travel, and therefore decarbonising society.
In other words, intensity measures a footprint, rather than a contribution. Low-carbon capital may be useless to the transition, and high-intensity capital may be at the heart of the solution.
Low carbon intensity does not make an investment virtuous: financing Grand Paris remains relevant despite high intensity.
Qualitative indicators: CIA, SBTi, CDP, ITR
The quantitative score must therefore be complemented by a qualitative reading of the asset’s relevance. Four indicators recur: CIA (Climate Impact Analytics, Carbone 4), SBTi alignment (Science Based Targets initiative), the CDP score (formerly Carbon Disclosure Project) and ITR (Implied Temperature Rise, expressed in degrees). They also incorporate dimensions beyond carbon (biodiversity, water and human rights) and help substantiate ESG claims without drifting into greenwashing.
6Which solution for which portfolio?
Depending on the number of issuers and the level of detail sought, two main approaches emerge.
Build a bespoke tool
Start with the portfolio’s actual composition (ISIN codes, market values) and scripts that query open ESG databases (CDP, ADEME and public data). Advantage: total flexibility, the ability to challenge each holding, complete methodological transparency. Limitation: collection becomes burdensome beyond a few hundred different issuers.
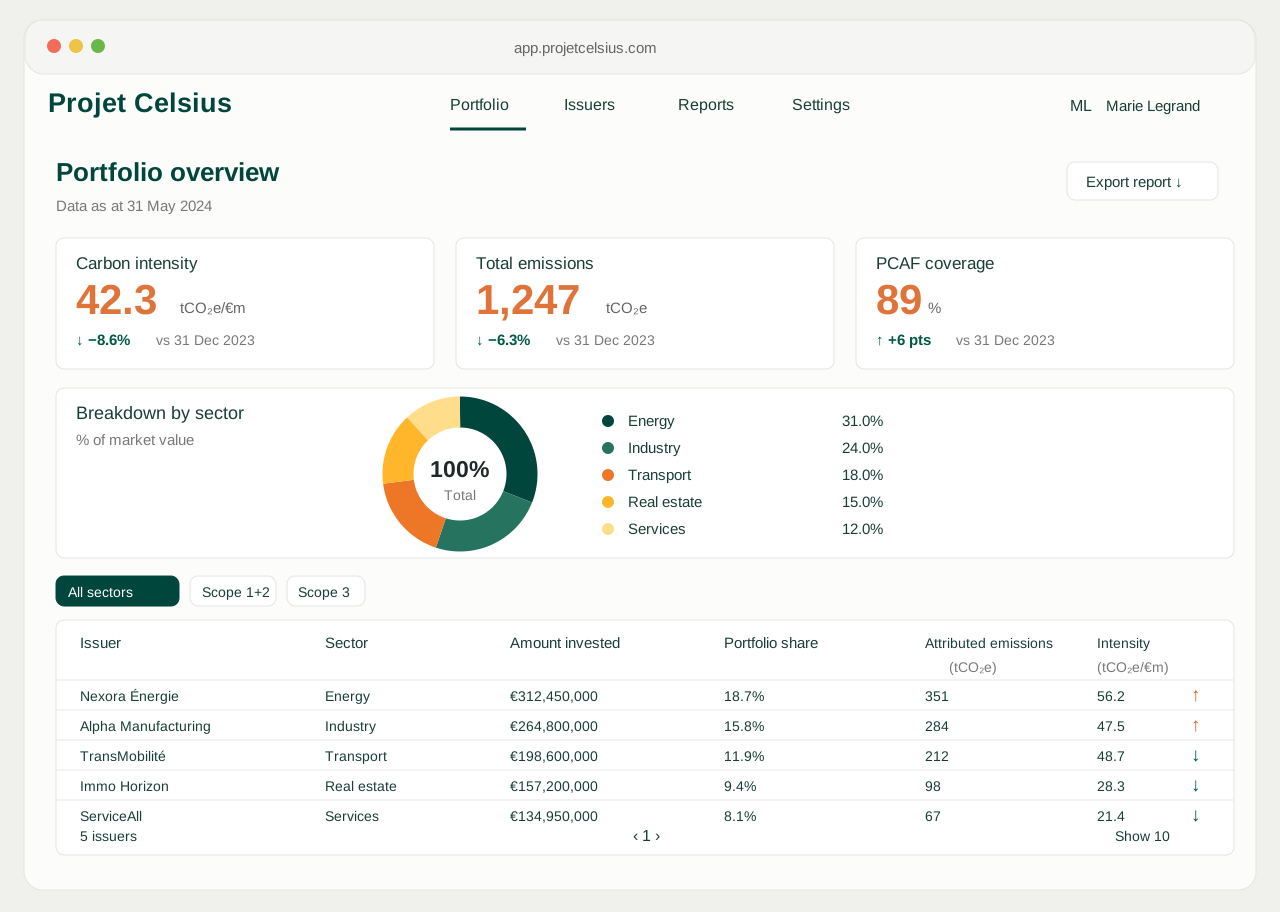
Projet Celsius can build a financed emissions management tool, calibrated to the actual composition of your investments. Total flexibility, methodological transparency and the ability to challenge each holding. Manual collection becomes burdensome beyond a few hundred different issuers: at that point, an ESG data provider becomes relevant.
Contract with an ESG data provider
Then subscribe to a specialist provider (ISS ESG, MSCI ESG, Trucost, Carbone 4 CIA). Advantage: extensive coverage (more than 10,000 listed issuers), automation and additional ESG indicators (controversies, SBTi alignment and exclusions). Limitation: a cost of €15,000 to €80,000/year depending on scope (comparable to the cost of a company Bilan Carbone®), less control over data accuracy, and methodologies that vary between providers for unlisted assets.
7Key takeaways
- Every investment (except currencies) emits because it finances emitting activities. It is often the largest source in an investor’s Bilan Carbone®, and this is what PCAF documents.
- The principle is simple: allocation proportionally to EVIC (market capitalisation + debt). Own 10% of a company, and 10% of its emissions are allocated to you. PCAF applies this logic to 7 asset classes.
- Double counting is normal once scope 3 is included: it captures the whole financing chain, rather than distorting the calculation.
- Low intensity does not make an investment virtuous. The sector matters more than the amount: a factor of around 400 between service technology (~8 tCO₂e/€million) and oil (~3,000). Always complement the quantitative with the qualitative (SBTi, CDP, ITR and exclusions).
For a manager or financial institution starting financed emissions reporting, the challenge is to acquire a management tool, rather than achieve perfection on the first attempt. Measuring where money goes then enables new investments to be directed towards transition organisations: industrial decarbonisation, low-carbon infrastructure and renovation, by directing finance towards the transition. This move from regulatory reporting to investment decisions turns measurement into an opportunity for action. For individuals, see our comparison of retail investments and our explanation of cryptocurrencies.
- PCAF - Global GHG Accounting and Reporting Standard for the Financial Industry (2024 edition) ↗
- GHG Protocol - Corporate Value Chain (Scope 3) Standard, category 15 Investments ↗
- EFRAG - ESRS E1 Climate Change ↗
- SFDR - Regulation (EU) 2019/2088 ↗
- TCFD - Recommendations ↗
- ISSB - IFRS S2 Climate-related Disclosures ↗
- Carbone 4 - CIA method (Climate Impact Analytics) ↗
- SBTi - Net-Zero Standard for Financial Institutions ↗
- CDP - Finance sector funded emissions over 700 times greater than its own (2023) ↗